Note
Go to the end to download the full example code or to run this example in your browser via Binder.
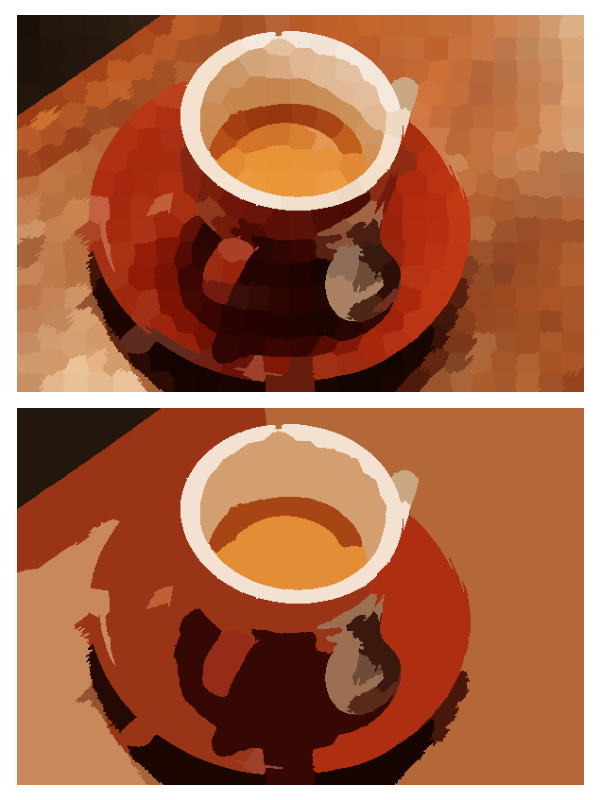
Normalized Cut#
This example constructs a Region Adjacency Graph (RAG) and recursively performs a Normalized Cut on it [1].
References#
from skimage import data, segmentation, color
from skimage import graph
from matplotlib import pyplot as plt


img = data.coffee()

labels1 = segmentation.slic(img, compactness=30, n_segments=400, start_label=1)
out1 = color.label2rgb(labels1, img, kind='avg', bg_label=0)

g = graph.rag_mean_color(img, labels1, mode='similarity')
labels2 = graph.cut_normalized(labels1, g)
out2 = color.label2rgb(labels2, img, kind='avg', bg_label=0)

fig, ax = plt.subplots(nrows=2, sharex=True, sharey=True, figsize=(6, 8))

ax[0].imshow(out1)
ax[1].imshow(out2)

for a in ax:
    a.axis('off')

plt.tight_layout()
Total running time of the script: (0 minutes 1.866 seconds)