Note
Go to the end to download the full example code or to run this example in your browser via Binder.
Active Contour Model#
The active contour model is a method to fit open or closed splines to lines or edges in an image [1]. It works by minimising an energy that is in part defined by the image and part by the spline’s shape: length and smoothness. The minimization is done implicitly in the shape energy and explicitly in the image energy.
In the following two examples the active contour model is used (1) to segment the face of a person from the rest of an image by fitting a closed curve to the edges of the face and (2) to find the darkest curve between two fixed points while obeying smoothness considerations. Typically it is a good idea to smooth images a bit before analyzing, as done in the following examples.
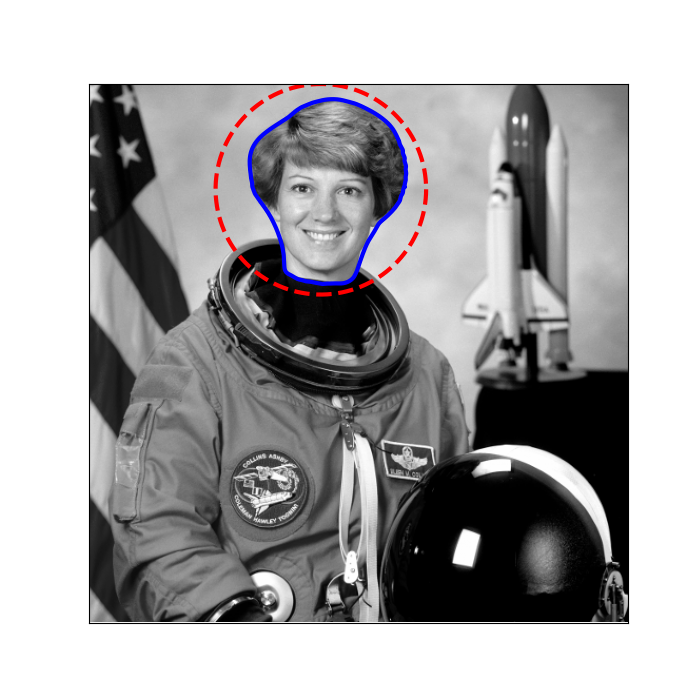
We initialize a circle around the astronaut’s face and use the default boundary
condition boundary_condition='periodic' to fit a closed curve. The default
parameters w_line=0, w_edge=1 will make the curve search towards edges,
such as the boundaries of the face.
import numpy as np
import matplotlib.pyplot as plt
from skimage.color import rgb2gray
from skimage import data
from skimage.filters import gaussian
from skimage.segmentation import active_contour


img = data.astronaut()
img = rgb2gray(img)

s = np.linspace(0, 2 * np.pi, 400)
r = 100 + 100 * np.sin(s)
c = 220 + 100 * np.cos(s)
init = np.array([r, c]).T

snake = active_contour(
    gaussian(img, sigma=3, preserve_range=False),
    init,
    alpha=0.015,
    beta=10,
    gamma=0.001,
)

fig, ax = plt.subplots(figsize=(7, 7))
ax.imshow(img, cmap=plt.cm.gray)
ax.plot(init[:, 1], init[:, 0], '--r', lw=3)
ax.plot(snake[:, 1], snake[:, 0], '-b', lw=3)
ax.set_xticks([]), ax.set_yticks([])
ax.axis([0, img.shape[1], img.shape[0], 0])

plt.show()
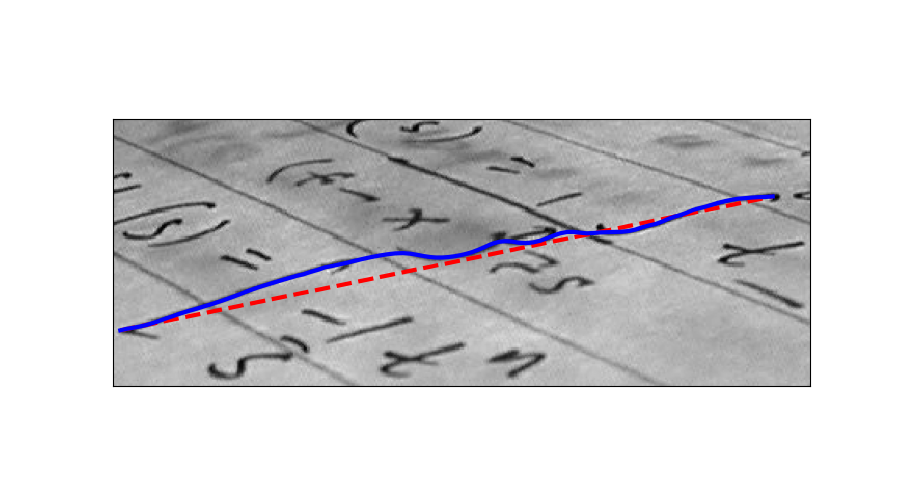
Here we initialize a straight line between two points, (5, 136) and
(424, 50), and require that the spline has its end points there by giving
the boundary condition boundary_condition='fixed'. We furthermore
make the algorithm search for dark lines by giving a negative w_line value.
img = data.text()

r = np.linspace(136, 50, 100)
c = np.linspace(5, 424, 100)
init = np.array([r, c]).T

snake = active_contour(
    gaussian(img, sigma=1, preserve_range=False),
    init,
    boundary_condition='fixed',
    alpha=0.1,
    beta=1.0,
    w_line=-5,
    w_edge=0,
    gamma=0.1,
)

fig, ax = plt.subplots(figsize=(9, 5))
ax.imshow(img, cmap=plt.cm.gray)
ax.plot(init[:, 1], init[:, 0], '--r', lw=3)
ax.plot(snake[:, 1], snake[:, 0], '-b', lw=3)
ax.set_xticks([]), ax.set_yticks([])
ax.axis([0, img.shape[1], img.shape[0], 0])

plt.show()
Total running time of the script: (0 minutes 2.180 seconds)