Note
Go to the end to download the full example code or to run this example in your browser via Binder.
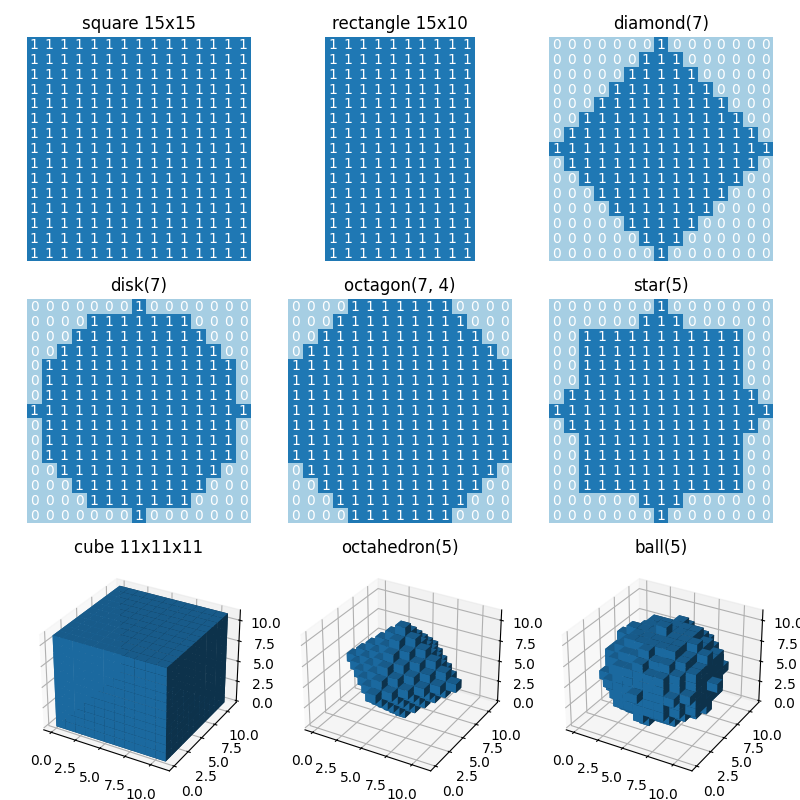
Generate footprints (structuring elements)#
This example shows how to use functions in skimage.morphology
to generate footprints (structuring elements) for use in morphology operations.
The title of each plot indicates the call of the function.
import matplotlib.pyplot as plt
from mpl_toolkits.mplot3d import Axes3D

from skimage.morphology import (
    footprint_rectangle,
    diamond,
    disk,
    octahedron,
    ball,
    octagon,
    star,
)

# Generate 2D and 3D structuring elements.
struc_2d = {
    "square 15x15": footprint_rectangle((15, 15)),
    "rectangle 15x10": footprint_rectangle((15, 10)),
    "diamond(7)": diamond(7),
    "disk(7)": disk(7),
    "octagon(7, 4)": octagon(7, 4),
    "star(5)": star(5),
}

struc_3d = {
    "cube 11x11x11": footprint_rectangle((11, 11, 11)),
    "octahedron(5)": octahedron(5),
    "ball(5)": ball(5),
}

# Visualize the elements.
fig = plt.figure(figsize=(8, 8))

idx = 1
for title, struc in struc_2d.items():
    ax = fig.add_subplot(3, 3, idx)
    ax.imshow(struc, cmap="Paired", vmin=0, vmax=12)
    for i in range(struc.shape[0]):
        for j in range(struc.shape[1]):
            ax.text(j, i, struc[i, j], ha="center", va="center", color="w")
    ax.set_axis_off()
    ax.set_title(title)
    idx += 1

for title, struc in struc_3d.items():
    ax = fig.add_subplot(3, 3, idx, projection=Axes3D.name)
    ax.voxels(struc)
    ax.set_title(title)
    idx += 1

fig.tight_layout()
plt.show()
Total running time of the script: (0 minutes 3.405 seconds)