Note
Go to the end to download the full example code or to run this example in your browser via Binder.
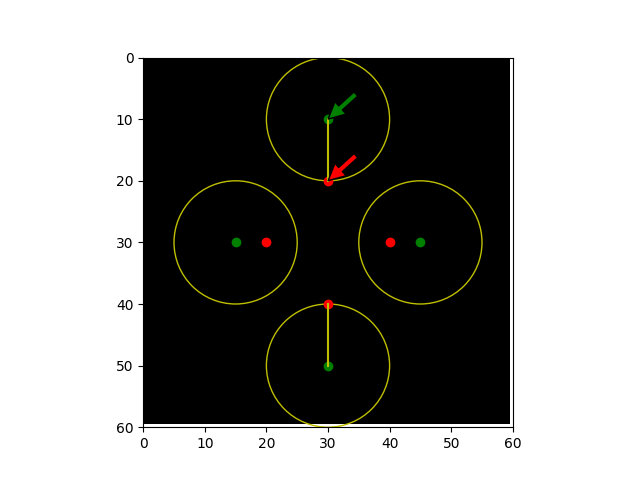
Hausdorff Distance#
This example shows how to calculate the Hausdorff distance between two sets of points. The Hausdorff distance is the maximum distance between any point on the first set and its nearest point on the second set, and vice-versa.
import matplotlib.pyplot as plt
import numpy as np

from skimage import metrics

shape = (60, 60)
image = np.zeros(shape)

# Create a diamond-like shape where the four corners form the 1st set of points
x_diamond = 30
y_diamond = 30
r = 10

fig, ax = plt.subplots()
plt_x = [0, 1, 0, -1]
plt_y = [1, 0, -1, 0]

set_ax = [(x_diamond + r * x) for x in plt_x]
set_ay = [(y_diamond + r * y) for y in plt_y]
plt.plot(set_ax, set_ay, 'or')

# Create a kite-like shape where the four corners form the 2nd set of points
x_kite = 30
y_kite = 30
x_r = 15
y_r = 20

set_bx = [(x_kite + x_r * x) for x in plt_x]
set_by = [(y_kite + y_r * y) for y in plt_y]
plt.plot(set_bx, set_by, 'og')

# Set up the data to compute the Hausdorff distance
coords_a = np.zeros(shape, dtype=bool)
coords_b = np.zeros(shape, dtype=bool)
for x, y in zip(set_ax, set_ay):
    coords_a[(x, y)] = True

for x, y in zip(set_bx, set_by):
    coords_b[(x, y)] = True

# Call the Hausdorff function on the coordinates
metrics.hausdorff_distance(coords_a, coords_b)
hausdorff_point_a, hausdorff_point_b = metrics.hausdorff_pair(coords_a, coords_b)

# Plot the lines that shows the length of the Hausdorff distance
x_line = [30, 30]
y_line = [20, 10]
plt.plot(x_line, y_line, 'y')

x_line = [30, 30]
y_line = [40, 50]
plt.plot(x_line, y_line, 'y')

# Plot circles to show that at this distance, the Hausdorff distance can
# travel to its nearest neighbor (in this case, from the kite to diamond)
ax.add_artist(plt.Circle((30, 10), 10, color='y', fill=None))
ax.add_artist(plt.Circle((30, 50), 10, color='y', fill=None))
ax.add_artist(plt.Circle((15, 30), 10, color='y', fill=None))
ax.add_artist(plt.Circle((45, 30), 10, color='y', fill=None))

# Annotate the returned pair of points that are Hausdorff distance apart
ax.annotate(
    'a',
    xy=hausdorff_point_a,
    xytext=(35, 15),
    arrowprops=dict(facecolor='red', shrink=0.005),
)
ax.annotate(
    'b',
    xy=hausdorff_point_b,
    xytext=(35, 5),
    arrowprops=dict(facecolor='green', shrink=0.005),
)

ax.imshow(image, cmap=plt.cm.gray)
ax.axis((0, 60, 60, 0))
plt.show()
Total running time of the script: (0 minutes 0.142 seconds)