Note
Go to the end to download the full example code or to run this example in your browser via Binder.
RGB to HSV#
This example illustrates how RGB to HSV (Hue, Saturation, Value) conversion [1] can be used to facilitate segmentation processes.
Usually, objects in images have distinct colors (hues) and luminosities, so that these features can be used to separate different areas of the image. In the RGB representation the hue and the luminosity are expressed as a linear combination of the R,G,B channels, whereas they correspond to single channels of the HSV image (the Hue and the Value channels). A simple segmentation of the image can then be effectively performed by a mere thresholding of the HSV channels.
import matplotlib.pyplot as plt

from skimage import data
from skimage.color import rgb2hsv
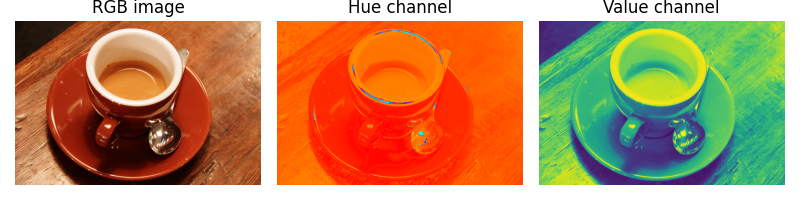
We first load the RGB image and extract the Hue and Value channels:
rgb_img = data.coffee()
hsv_img = rgb2hsv(rgb_img)
hue_img = hsv_img[:, :, 0]
value_img = hsv_img[:, :, 2]

fig, (ax0, ax1, ax2) = plt.subplots(ncols=3, figsize=(8, 2))

ax0.imshow(rgb_img)
ax0.set_title("RGB image")
ax0.axis('off')
ax1.imshow(hue_img, cmap='hsv')
ax1.set_title("Hue channel")
ax1.axis('off')
ax2.imshow(value_img)
ax2.set_title("Value channel")
ax2.axis('off')

fig.tight_layout()
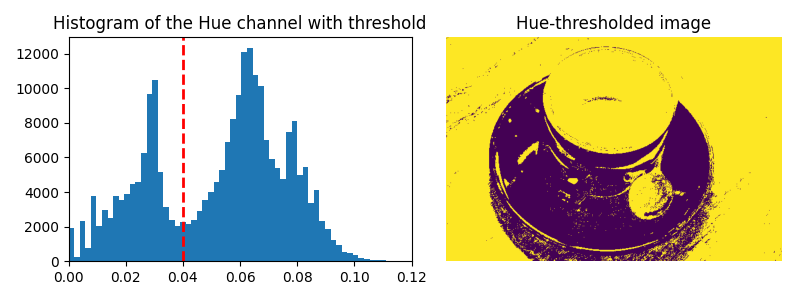
We then set a threshold on the Hue channel to separate the cup from the background:
hue_threshold = 0.04
binary_img = hue_img > hue_threshold

fig, (ax0, ax1) = plt.subplots(ncols=2, figsize=(8, 3))

ax0.hist(hue_img.ravel(), 512)
ax0.set_title("Histogram of the Hue channel with threshold")
ax0.axvline(x=hue_threshold, color='r', linestyle='dashed', linewidth=2)
ax0.set_xbound(0, 0.12)
ax1.imshow(binary_img)
ax1.set_title("Hue-thresholded image")
ax1.axis('off')

fig.tight_layout()
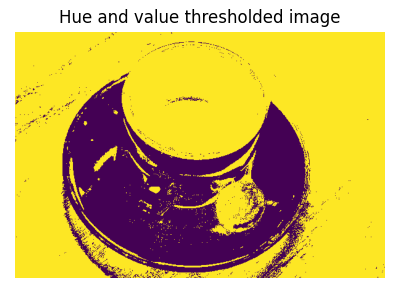
We finally perform an additional thresholding on the Value channel to partly remove the shadow of the cup:
fig, ax0 = plt.subplots(figsize=(4, 3))

value_threshold = 0.10
binary_img = (hue_img > hue_threshold) | (value_img < value_threshold)

ax0.imshow(binary_img)
ax0.set_title("Hue and value thresholded image")
ax0.axis('off')

fig.tight_layout()
plt.show()
Total running time of the script: (0 minutes 1.198 seconds)