Note
Go to the end to download the full example code or to run this example in your browser via Binder.
Estimate strength of blur#
This example shows how the metric implemented in measure.blur_effect
behaves, both as a function of the strength of blur and of the size of the
re-blurring filter. This no-reference perceptual blur metric is described in
[1].
import matplotlib.pyplot as plt
import numpy as np
import pandas as pd
import scipy.ndimage as ndi

import plotly
import plotly.express as px
from skimage import color, data, measure
Generate series of increasingly blurred images#
Let us load an image available through scikit-image’s data registry. The blur metric applies to single-channel images.
image = data.astronaut()
image = color.rgb2gray(image)
Let us blur this image with a series of uniform filters of increasing size.
blurred_images = [ndi.uniform_filter(image, size=k) for k in range(2, 32, 2)]
img_stack = np.stack(blurred_images)

fig = px.imshow(
    img_stack,
    animation_frame=0,
    binary_string=True,
    labels={'animation_frame': 'blur strength ~'},
)
plotly.io.show(fig)
Plot blur metric#
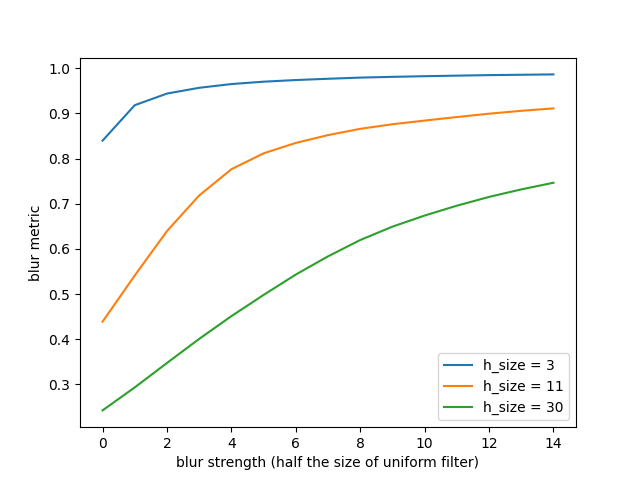
Let us compute the blur metric for all blurred images: We expect it to increase towards 1 with increasing blur strength. We compute it for three different values of re-blurring filter: 3, 11 (default), and 30.
B = pd.DataFrame(
    data=np.zeros((len(blurred_images), 3)),
    columns=['h_size = 3', 'h_size = 11', 'h_size = 30'],
)
for ind, im in enumerate(blurred_images):
    B.loc[ind, 'h_size = 3'] = measure.blur_effect(im, h_size=3)
    B.loc[ind, 'h_size = 11'] = measure.blur_effect(im, h_size=11)
    B.loc[ind, 'h_size = 30'] = measure.blur_effect(im, h_size=30)

B.plot().set(
    xlabel='blur strength (half the size of uniform filter)', ylabel='blur metric'
)

plt.show()

We can see that as soon as the blur is stronger than (reaches the scale of)
the size of the uniform filter, the metric gets close to 1 and, hence, tends
asymptotically to 1 with increasing blur strength.
The value of 11 pixels gives a blur metric which correlates best with human
perception. That’s why it’s the default value in the implementation of the
perceptual blur metric measure.blur_effect.
Total running time of the script: (0 minutes 1.774 seconds)
