Note
Go to the end to download the full example code or to run this example in your browser via Binder.
Straight line Hough transform#
The Hough transform in its simplest form is a method to detect straight lines [1].
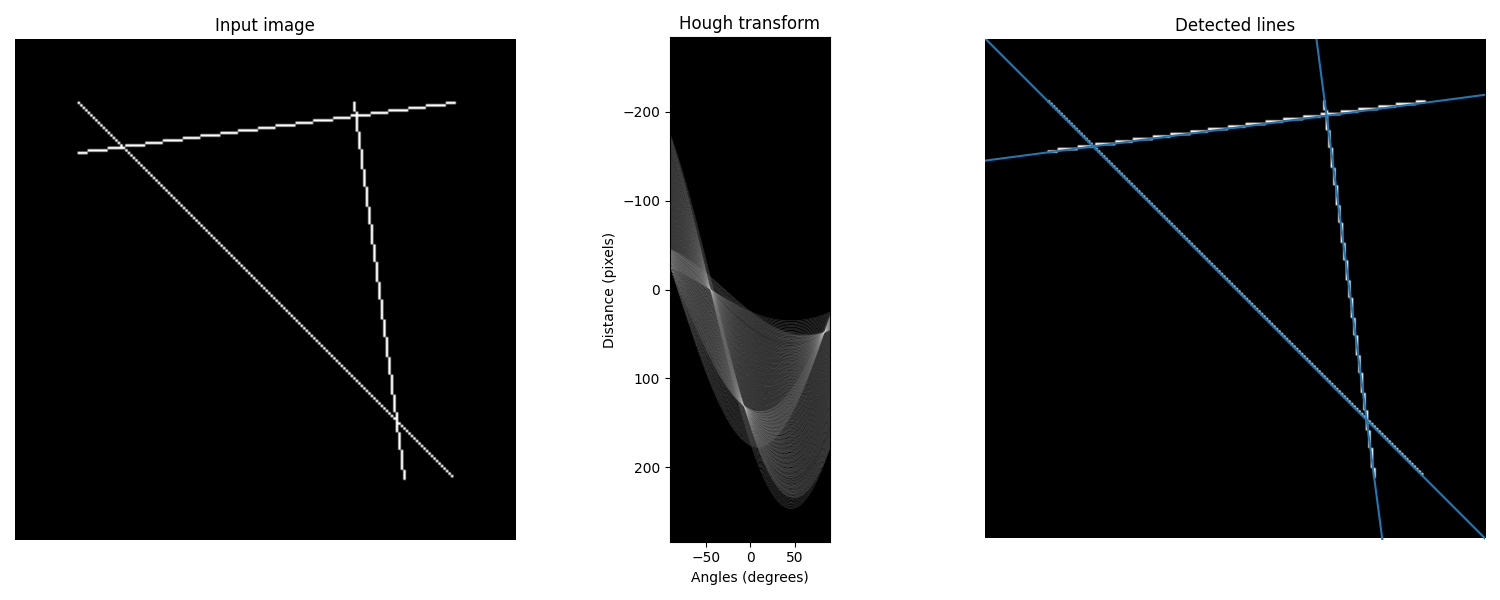
In the following example, we construct an image with a line intersection. We then use the Hough transform. to explore a parameter space for straight lines that may run through the image.
Algorithm overview#
Usually, lines are parameterised as \(y = mx + c\), with a gradient
\(m\) and y-intercept c. However, this would mean that \(m\) goes to
infinity for vertical lines. Instead, we therefore construct a segment
perpendicular to the line, leading to the origin. The line is represented by
the length of that segment, \(r\), and the angle it makes with the x-axis,
\(\theta\).
The Hough transform constructs a histogram array representing the parameter space (i.e., an \(M \times N\) matrix, for \(M\) different values of the radius and \(N\) different values of \(\theta\)). For each parameter combination, \(r\) and \(\theta\), we then find the number of non-zero pixels in the input image that would fall close to the corresponding line, and increment the array at position \((r, \theta)\) appropriately.
We can think of each non-zero pixel “voting” for potential line candidates. The local maxima in the resulting histogram indicates the parameters of the most probable lines. In our example, the maxima occur at 45 and 135 degrees, corresponding to the normal vector angles of each line.
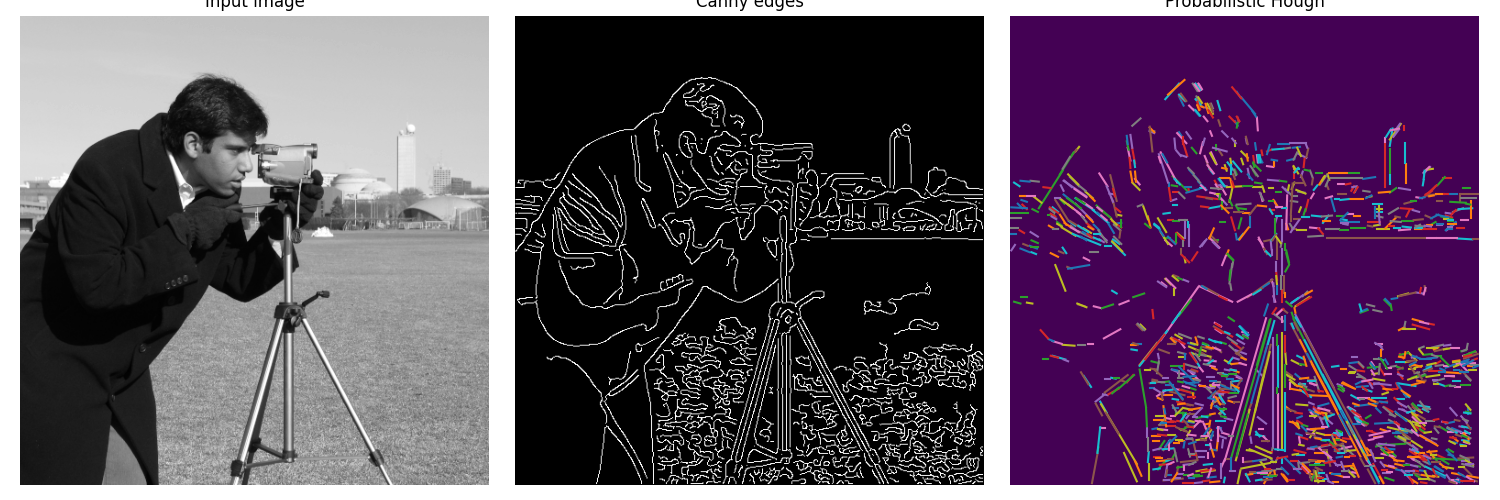
Another approach is the Progressive Probabilistic Hough Transform [2]. It is based on the assumption that using a random subset of voting points give a good approximation to the actual result, and that lines can be extracted during the voting process by walking along connected components. This returns the beginning and end of each line segment, which is useful.
The function probabilistic_hough has three parameters: a general threshold
that is applied to the Hough accumulator, a minimum line length and the line
gap that influences line merging. In the example below, we find lines longer
than 10 with a gap less than 3 pixels.
References#
Line Hough Transform#
import numpy as np

from skimage.transform import hough_line, hough_line_peaks
from skimage.feature import canny
from skimage.draw import line as draw_line
from skimage import data

import matplotlib.pyplot as plt
from matplotlib import cm


# Constructing test image
image = np.zeros((200, 200))
idx = np.arange(25, 175)
image[idx, idx] = 255
image[draw_line(45, 25, 25, 175)] = 255
image[draw_line(25, 135, 175, 155)] = 255

# Classic straight-line Hough transform
# Set a precision of 0.5 degree.
tested_angles = np.linspace(-np.pi / 2, np.pi / 2, 360, endpoint=False)
h, theta, d = hough_line(image, theta=tested_angles)

# Generating figure 1
fig, axes = plt.subplots(1, 3, figsize=(15, 6))
ax = axes.ravel()

ax[0].imshow(image, cmap=cm.gray)
ax[0].set_title('Input image')
ax[0].set_axis_off()

angle_step = 0.5 * np.diff(theta).mean()
d_step = 0.5 * np.diff(d).mean()
bounds = [
    np.rad2deg(theta[0] - angle_step),
    np.rad2deg(theta[-1] + angle_step),
    d[-1] + d_step,
    d[0] - d_step,
]
ax[1].imshow(np.log(1 + h), extent=bounds, cmap=cm.gray, aspect=1 / 1.5)
ax[1].set_title('Hough transform')
ax[1].set_xlabel('Angles (degrees)')
ax[1].set_ylabel('Distance (pixels)')
ax[1].axis('image')

ax[2].imshow(image, cmap=cm.gray)
ax[2].set_ylim((image.shape[0], 0))
ax[2].set_axis_off()
ax[2].set_title('Detected lines')

for _, angle, dist in zip(*hough_line_peaks(h, theta, d)):
    (x0, y0) = dist * np.array([np.cos(angle), np.sin(angle)])
    ax[2].axline((x0, y0), slope=np.tan(angle + np.pi / 2))

plt.tight_layout()
plt.show()
Probabilistic Hough Transform#
from skimage.transform import probabilistic_hough_line

# Line finding using the Probabilistic Hough Transform
image = data.camera()
edges = canny(image, 2, 1, 25)
lines = probabilistic_hough_line(edges, threshold=10, line_length=5, line_gap=3)

# Generating figure 2
fig, axes = plt.subplots(1, 3, figsize=(15, 5), sharex=True, sharey=True)
ax = axes.ravel()

ax[0].imshow(image, cmap=cm.gray)
ax[0].set_title('Input image')

ax[1].imshow(edges, cmap=cm.gray)
ax[1].set_title('Canny edges')

ax[2].imshow(edges * 0)
for line in lines:
    p0, p1 = line
    ax[2].plot((p0[0], p1[0]), (p0[1], p1[1]))
ax[2].set_xlim((0, image.shape[1]))
ax[2].set_ylim((image.shape[0], 0))
ax[2].set_title('Probabilistic Hough')

for a in ax:
    a.set_axis_off()

plt.tight_layout()
plt.show()
Total running time of the script: (0 minutes 2.372 seconds)