Note
Go to the end to download the full example code or to run this example in your browser via Binder.
Shape Index#
The shape index is a single valued measure of local curvature, derived from the eigen values of the Hessian, defined by Koenderink & van Doorn [1].
It can be used to find structures based on their apparent local shape.
The shape index maps to values from -1 to 1, representing different kind of shapes (see the documentation for details).
In this example, a random image with spots is generated, which should be detected.
A shape index of 1 represents ‘spherical caps’, the shape of the spots we want to detect.
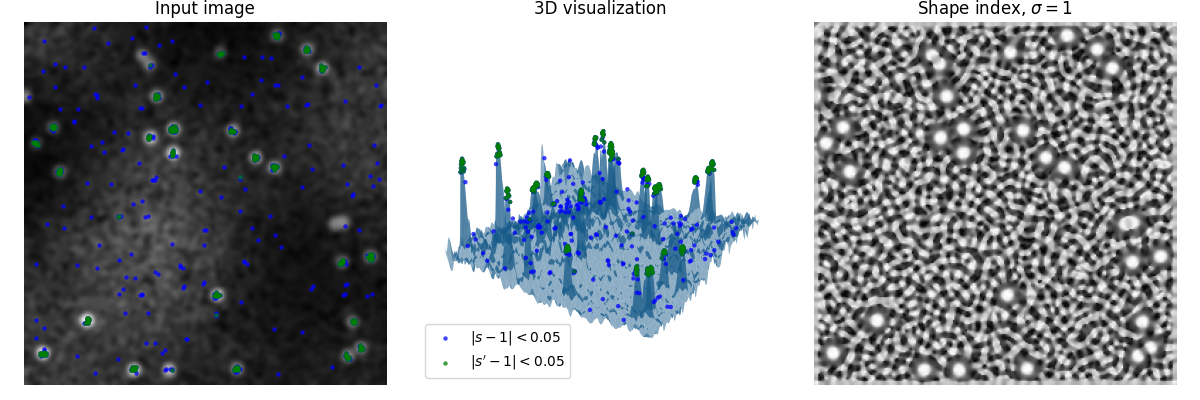
The leftmost plot shows the generated image, the center shows a 3D render of the image, taking intensity values as height of a 3D surface, and the right one shows the shape index (s).
As visible, the shape index readily amplifies the local shape of noise as well, but is insusceptible to global phenomena (e.g. uneven illumination).
The blue and green marks are points which deviate no more than 0.05 from the desired shape. To attenuate noise in the signal, the green marks are taken from the shape index (s) after another Gaussian blur pass (yielding s’).
Note how spots interjoined too closely are not detected, as they do not posses the desired shape.
import numpy as np
import matplotlib.pyplot as plt
from scipy import ndimage as ndi
from skimage.feature import shape_index
from skimage.draw import disk


def create_test_image(image_size=256, spot_count=30, spot_radius=5, cloud_noise_size=4):
    """
    Generate a test image with random noise, uneven illumination and spots.
    """
    rng = np.random.default_rng()
    image = rng.normal(loc=0.25, scale=0.25, size=(image_size, image_size))

    for _ in range(spot_count):
        rr, cc = disk(
            (rng.integers(image.shape[0]), rng.integers(image.shape[1])),
            spot_radius,
            shape=image.shape,
        )
        image[rr, cc] = 1

    image *= rng.normal(loc=1.0, scale=0.1, size=image.shape)

    image *= ndi.zoom(
        rng.normal(loc=1.0, scale=0.5, size=(cloud_noise_size, cloud_noise_size)),
        image_size / cloud_noise_size,
    )

    return ndi.gaussian_filter(image, sigma=2.0)


# First create the test image and its shape index

image = create_test_image()

s = shape_index(image)

# In this example we want to detect 'spherical caps',
# so we threshold the shape index map to
# find points which are 'spherical caps' (~1)

target = 1
delta = 0.05

point_y, point_x = np.where(np.abs(s - target) < delta)
point_z = image[point_y, point_x]

# The shape index map relentlessly produces the shape, even that of noise.
# In order to reduce the impact of noise, we apply a Gaussian filter to it,
# and show the results once in

s_smooth = ndi.gaussian_filter(s, sigma=0.5)

point_y_s, point_x_s = np.where(np.abs(s_smooth - target) < delta)
point_z_s = image[point_y_s, point_x_s]


fig = plt.figure(figsize=(12, 4))
ax1 = fig.add_subplot(1, 3, 1)

ax1.imshow(image, cmap=plt.cm.gray)
ax1.axis('off')
ax1.set_title('Input image')

scatter_settings = dict(alpha=0.75, s=10, linewidths=0)

ax1.scatter(point_x, point_y, color='blue', **scatter_settings)
ax1.scatter(point_x_s, point_y_s, color='green', **scatter_settings)

ax2 = fig.add_subplot(1, 3, 2, projection='3d', sharex=ax1, sharey=ax1)

x, y = np.meshgrid(np.arange(0, image.shape[0], 1), np.arange(0, image.shape[1], 1))

ax2.plot_surface(x, y, image, linewidth=0, alpha=0.5)

ax2.scatter(
    point_x, point_y, point_z, color='blue', label='$|s - 1|<0.05$', **scatter_settings
)

ax2.scatter(
    point_x_s,
    point_y_s,
    point_z_s,
    color='green',
    label='$|s\' - 1|<0.05$',
    **scatter_settings,
)

ax2.legend(loc='lower left')

ax2.axis('off')
ax2.set_title('3D visualization')

ax3 = fig.add_subplot(1, 3, 3, sharex=ax1, sharey=ax1)

ax3.imshow(s, cmap=plt.cm.gray)
ax3.axis('off')
ax3.set_title(r'Shape index, $\sigma=1$')

fig.tight_layout()

plt.show()
Total running time of the script: (0 minutes 1.165 seconds)