Note
Go to the end to download the full example code or to run this example in your browser via Binder.
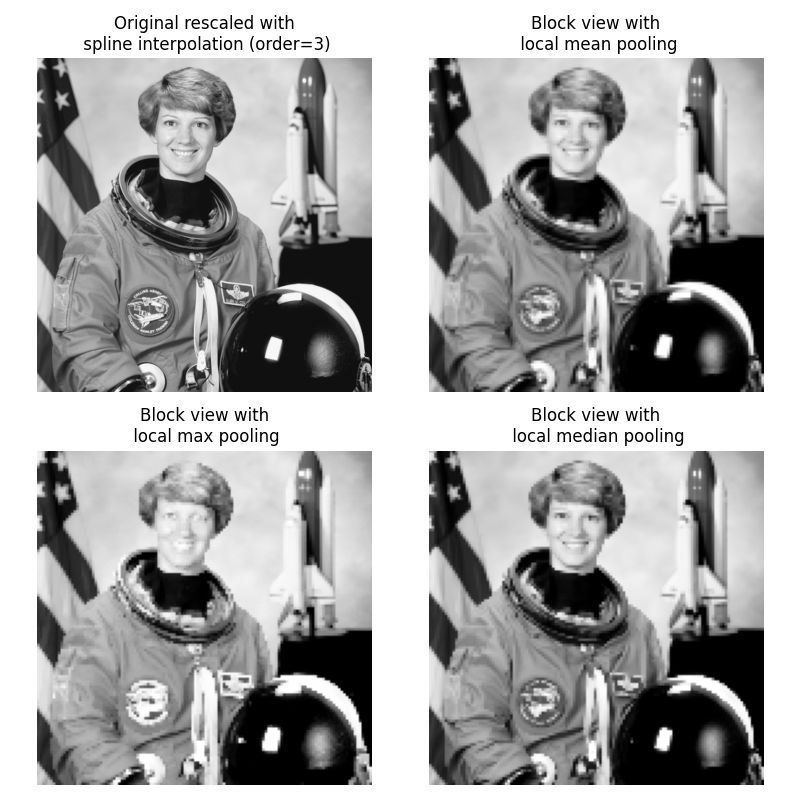
Block views on images/arrays#
This example illustrates the use of view_as_blocks from
skimage.util(). Block views can be incredibly useful when one
wants to perform local operations on non-overlapping image patches.
We use astronaut from skimage.data and virtually ‘slice’ it into square
blocks. Then, on each block, we either pool the mean, the max or the
median value of that block. The results are displayed altogether, along
with a spline interpolation of order 3 rescaling of the original astronaut
image.
import numpy as np
from scipy import ndimage as ndi
from matplotlib import pyplot as plt
import matplotlib.cm as cm

import skimage as ski


# get astronaut from skimage.data in grayscale
l = ski.color.rgb2gray(ski.data.astronaut())

# size of blocks
block_shape = (4, 4)

# see astronaut as a matrix of blocks (of shape block_shape)
view = ski.util.view_as_blocks(l, block_shape)

# collapse the last two dimensions in one
flatten_view = view.reshape(view.shape[0], view.shape[1], -1)

# resampling the image by taking either the `mean`,
# the `max` or the `median` value of each blocks.
mean_view = np.mean(flatten_view, axis=2)
max_view = np.max(flatten_view, axis=2)
median_view = np.median(flatten_view, axis=2)

# display resampled images
fig, axes = plt.subplots(2, 2, figsize=(8, 8), sharex=True, sharey=True)
ax = axes.ravel()

l_resized = ndi.zoom(l, 2, order=3)
ax[0].set_title("Original rescaled with\n spline interpolation (order=3)")
ax[0].imshow(l_resized, extent=(-0.5, 128.5, 128.5, -0.5), cmap=cm.Greys_r)

ax[1].set_title("Block view with\n local mean pooling")
ax[1].imshow(mean_view, cmap=cm.Greys_r)

ax[2].set_title("Block view with\n local max pooling")
ax[2].imshow(max_view, cmap=cm.Greys_r)

ax[3].set_title("Block view with\n local median pooling")
ax[3].imshow(median_view, cmap=cm.Greys_r)

for a in ax:
    a.set_axis_off()

fig.tight_layout()
plt.show()
Total running time of the script: (0 minutes 0.859 seconds)