Note
Go to the end to download the full example code or to run this example in your browser via Binder.
Hysteresis thresholding#
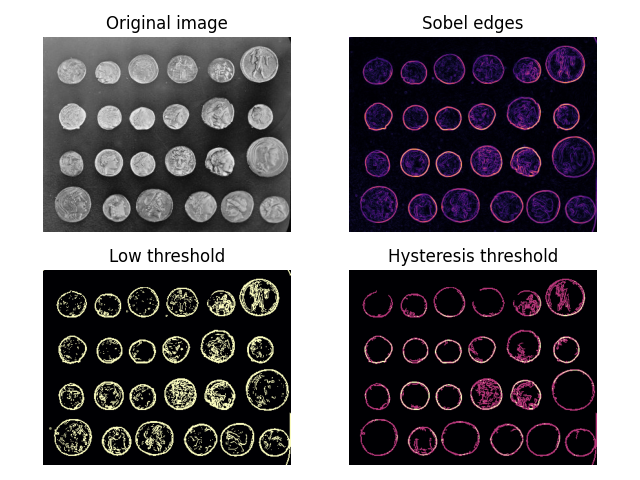
Hysteresis is the lagging of an effect—a kind of inertia. In the context of thresholding, it means that areas above some low threshold are considered to be above the threshold if they are also connected to areas above a higher, more stringent, threshold. They can thus be seen as continuations of these high-confidence areas.
Below, we compare normal thresholding to hysteresis thresholding. Notice how hysteresis allows one to ignore “noise” outside of the coin edges.
import matplotlib.pyplot as plt
from skimage import data, filters

fig, ax = plt.subplots(nrows=2, ncols=2)

image = data.coins()
edges = filters.sobel(image)

low = 0.1
high = 0.35

lowt = (edges > low).astype(int)
hight = (edges > high).astype(int)
hyst = filters.apply_hysteresis_threshold(edges, low, high)

ax[0, 0].imshow(image, cmap='gray')
ax[0, 0].set_title('Original image')

ax[0, 1].imshow(edges, cmap='magma')
ax[0, 1].set_title('Sobel edges')

ax[1, 0].imshow(lowt, cmap='magma')
ax[1, 0].set_title('Low threshold')

ax[1, 1].imshow(hight + hyst, cmap='magma')
ax[1, 1].set_title('Hysteresis threshold')

for a in ax.ravel():
    a.axis('off')

plt.tight_layout()

plt.show()
Total running time of the script: (0 minutes 0.458 seconds)