Note
Go to the end to download the full example code or to run this example in your browser via Binder.
Find the intersection of two segmentations#
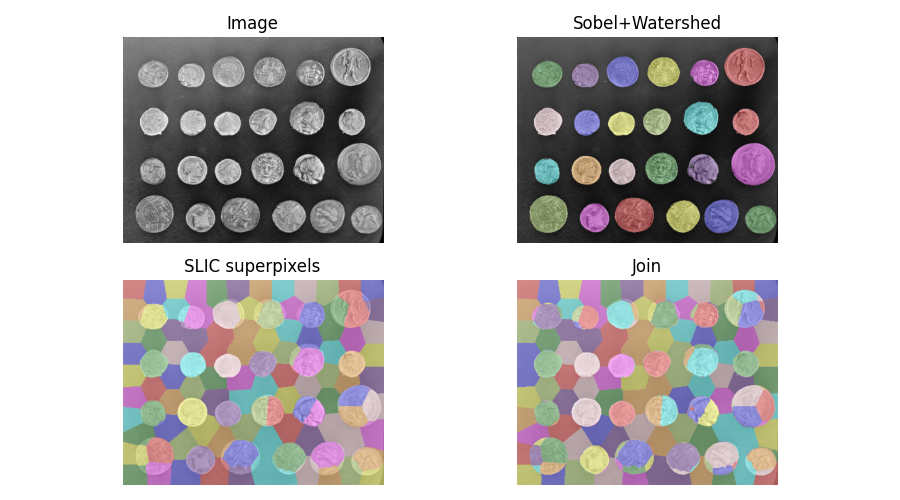
When segmenting an image, you may want to combine multiple alternative
segmentations. The skimage.segmentation.join_segmentations()
function computes the join of two segmentations, in which a pixel is
placed in the same segment if and only if it is in the same segment in
both segmentations.

import numpy as np
import matplotlib.pyplot as plt

from skimage.filters import sobel
from skimage.measure import label
from skimage.segmentation import slic, join_segmentations, watershed
from skimage.color import label2rgb
from skimage import data

coins = data.coins()

# Make segmentation using edge-detection and watershed.
edges = sobel(coins)

# Identify some background and foreground pixels from the intensity values.
# These pixels are used as seeds for watershed.
markers = np.zeros_like(coins)
foreground, background = 1, 2
markers[coins < 30.0] = background
markers[coins > 150.0] = foreground

ws = watershed(edges, markers)
seg1 = label(ws == foreground)

# Make segmentation using SLIC superpixels.
seg2 = slic(
    coins,
    n_segments=117,
    max_num_iter=160,
    sigma=1,
    compactness=0.75,
    channel_axis=None,
    start_label=0,
)

# Combine the two.
segj = join_segmentations(seg1, seg2)

# Show the segmentations.
fig, axes = plt.subplots(ncols=2, nrows=2, figsize=(9, 5), sharex=True, sharey=True)
ax = axes.ravel()
ax[0].imshow(coins, cmap='gray')
ax[0].set_title('Image')

color1 = label2rgb(seg1, image=coins, bg_label=0)
ax[1].imshow(color1)
ax[1].set_title('Sobel+Watershed')

color2 = label2rgb(seg2, image=coins, image_alpha=0.5, bg_label=-1)
ax[2].imshow(color2)
ax[2].set_title('SLIC superpixels')

color3 = label2rgb(segj, image=coins, image_alpha=0.5, bg_label=-1)
ax[3].imshow(color3)
ax[3].set_title('Join')

for a in ax:
    a.axis('off')
fig.tight_layout()
plt.show()
Total running time of the script: (0 minutes 1.625 seconds)
