skimage.filters.meijering documents its alpha argument as a “shaping filter
constant, that tunes shape selection to flat elongated features, rather than
blob-like features”, with a default of . The shipped code
uses .
meijering_alpha.md works through the paper’s derivation and shows why the
minus sign is the right one. This notebook asks a narrower question:
What should a test suite assert about α, such that every assertion can be justified to a reader who has never opened the paper?
The answer is five tests. Each one is a sentence about a picture, and each
sentence is checkable by eye before it is checked by assert. No eigenvalue
appears in any of them.
import numpy as np
import pandas as pd
import scipy.ndimage as ndi
import matplotlib.pyplot as plt

from nbhelper import show_table
import skimage as ski
from skimage.filters import meijeringfatal: not a git repository (or any of the parent directories): .git
fatal: not a git repository (or any of the parent directories): .git
# Slots 1 to 3 of the reference categorical palette, validated all-pairs;
# same palette as `meijering_alpha.md` and `on_meijering.md`.
C_ONE, C_TWO, C_THREE = "#2a78d6", "#eb6834", "#1baf7a"
INK, MUTED, RULE = "#0b0b0b", "#52514e", "#dedcd5"

plt.rcParams.update(
    {"figure.dpi": 110, "font.size": 9, "axes.titlesize": 9,
     "axes.titlecolor": MUTED, "figure.facecolor": "white"}
)


def bare(ax, title=None):
    """Strip an image axes down to the pixels."""
    ax.set_xticks([]); ax.set_yticks([])
    for spine in ax.spines.values():
        spine.set_visible(False)
    if title:
        ax.set_title(title)
    return ax


def recede(ax, title=None):
    """Push a plot axes' furniture into the background."""
    ax.tick_params(labelsize=8, colors=MUTED)
    for spine in ("top", "right"):
        ax.spines[spine].set_visible(False)
    for spine in ("left", "bottom"):
        ax.spines[spine].set_color(RULE)
    if title:
        ax.set_title(title)
    return ax
1. The one rule that makes all of this work¶
meijering divides its output by its own maximum before returning it, once per
scale. So no single number that comes out of the filter means anything on its
own: feed it a picture of one blob and the blob reads 1.0, feed it a picture of
one line and the line reads 1.0.
N, WIDTH, SIGMA = 161, 4.0, 4.0
rows, cols = np.indices((N, N), dtype=float)

# One structure per image: two different pictures, same answer.
alone = {
    "a dot, alone": (np.exp(-((rows - 40) ** 2 + (cols - 120) ** 2)
                            / (2 * WIDTH**2)), (40, 120)),
    "a line, alone": (np.exp(-((rows - 100) ** 2) / (2 * WIDTH**2)), (100, 40)),
}
show_table(pd.DataFrame(
    [{"image": name,
      **{f"α = {a:+.3f}": meijering(img, sigmas=[SIGMA], alpha=a,
                                    black_ridges=False)[at]
         for a in (0.0, -1 / 3, 1 / 3)}}
for name, (img, at) in alone.items()]).round(6), index="image")Every entry is exactly 1.0. A test built on one structure per image cannot fail, whatever α does, because the structure it probes is the thing that set the divisor.
The rule that follows is the only piece of machinery in this notebook:
Put both structures in the same picture, and assert on the comparison between them.
The per-scale divisor is one number applied to the whole picture, so it cancels out of any ratio taken inside that picture. Ratios are the only quantities the filter’s output actually carries.
2. The test picture: a dot and a line the filter cannot tell apart¶
We want a picture where α is the only thing that decides the outcome. That means starting from a dot and a line that score equally when α is switched off, so that any inequality afterwards is attributable to α and to nothing else.
They do not start equal by default. Blurring costs a round dot more height than it costs a long line, because the dot is being spread in every direction at once and the line only across itself. The correction is one factor, and it is the same factor in any number of dimensions:
for a structure of width seen at filter scale . The cell below checks that claim by measuring the dot-to-line score with the correction left out, over several combinations of and .
def dot_and_line(width=WIDTH, sigma=SIGMA, amplitude=1.0, angle=0.0,
                 line_at=(100, 40), dot_at=(40, 120), size=N):
    """A bright line at `angle` and a bright dot, in one square image."""
    rr, cc = np.indices((size, size), dtype=float)
    t = np.deg2rad(angle)
    across = (rr - line_at[0]) * np.cos(t) - (cc - line_at[1]) * np.sin(t)
    line = np.exp(-across**2 / (2 * width**2))
    dot = amplitude * np.exp(-((rr - dot_at[0]) ** 2 + (cc - dot_at[1]) ** 2)
                             / (2 * width**2))
    return line + dot


def scores(image, alpha, sigma=SIGMA, dot_at=(40, 120), line_at=(100, 40)):
    """The filter's response at the dot centre and at the line centre."""
    out = meijering(image, sigmas=[sigma], alpha=alpha, black_ridges=False)
    return out[dot_at], out[line_at]


show_table(pd.DataFrame(
    [{"w": w, "σ": s,
      "uncorrected dot / line, α = 0":
          np.divide(*scores(dot_and_line(width=w, sigma=s), 0.0, sigma=s)),
      "√(1 + σ²/w²), inverted": 1 / np.sqrt(1 + s**2 / w**2)}
     for w, s in ((4.0, 4.0), (4.0, 2.0), (6.0, 3.0), (3.0, 6.0))]).round(6),
index=["w", "σ"])The two columns agree to six figures, so the factor is understood and we can cancel it. From here on the dot carries that amplitude, and the picture is one in which the filter, with its shaping switched off, scores a dot and a line exactly alike.
AMPLITUDE = np.sqrt(1 + SIGMA**2 / WIDTH**2)
SCENE = dot_and_line(amplitude=AMPLITUDE)
DOT_AT, LINE_AT = (40, 120), (100, 40)

SETTINGS = [("α = 0, shaping off", 0.0),
            ("α = −1/3, documented", -1 / 3),
            ("α = +1/3, shipped", +1 / 3)]

fig, axes = plt.subplots(1, 4, figsize=(9.6, 2.9))
bare(axes[0], "the test picture")
axes[0].imshow(SCENE, cmap="gray")
for ax, (label, alpha) in zip(axes[1:], SETTINGS):
    out = meijering(SCENE, sigmas=[SIGMA], alpha=alpha, black_ridges=False)
    bare(ax, label)
    ax.imshow(out, cmap="gray", vmin=0, vmax=1)
    for at, name in ((DOT_AT, "dot"), (LINE_AT, "line")):
        ax.annotate(f"{name} {out[at]:.3f}", xy=(at[1], at[0]),
                    xytext=(0, -14), textcoords="offset points",
                    ha="center", fontsize=8, color=C_TWO,
                    path_effects=None)
fig.suptitle("same picture, same scale, three settings of one dial", y=1.03)
fig.tight_layout()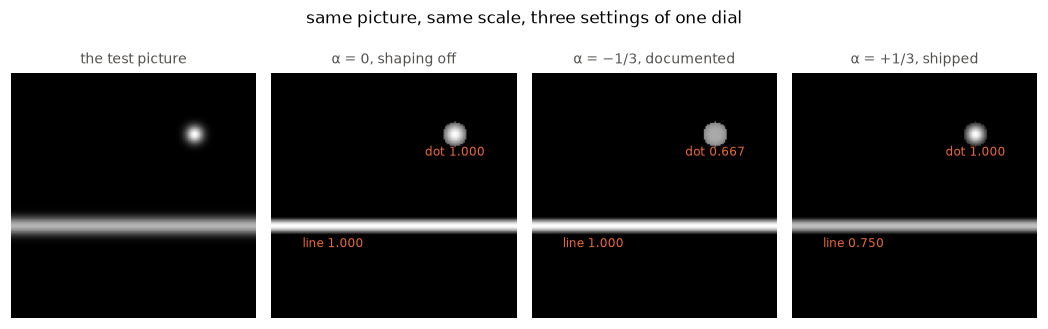
That figure is the whole argument. With the dial off the dot and the line both read 1.000. With the documented value the line still reads 1.000 and the dot drops to 0.667. With the shipped value the dot holds 1.000 and the line falls to 0.750 — the ridge filter now prefers the blob.
3. Test 1 — with the default, a line must beat a dot¶
This is the docstring’s own promise, read literally: “tunes shape selection to flat elongated features, rather than blob-like features”. On a picture whose dot and line are matched, the line must come out higher.
def ranking(alpha):
    """Which structure the filter scores higher, and by how much."""
    dot, line = scores(SCENE, alpha)
    winner = "tie" if abs(dot - line) < 1e-9 else ("line" if line > dot else "dot")
    return {"dot": dot, "line": line, "winner": winner, "dot / line": dot / line}


show_table(pd.DataFrame(
    [{"setting": label, **ranking(alpha)} for label, alpha in SETTINGS]
    + [{"setting": "alpha=None, as installed", **ranking(None)}]
).round(6), index="setting")The installed default loses this test, and loses it the same way the explicit does. Nothing about the failure is marginal: the dot is 33% clear of the line, in a picture built so that they tie when the dial is off.
4. Test 2 — the dot must score exactly two thirds of the line¶
Test 1 asserts an inequality, which a wrong-but-still-negative α would also satisfy. The default pins an exact number, and the number is worth knowing because it is the same in two and in three dimensions.
The arithmetic needs no linear algebra. The filter measures how sharply the picture bends, in each of the image’s directions at a point. α says: before scoring, add α times the bending in the other directions.
At a dot, all directions bend alike, so each score picks up copies of itself: it becomes times what it was.
Along a line the picture is flat, so one of those directions contributes nothing. The remaining copies give .
Put into both and the cancels:
| structure | factor | at |
|---|---|---|
| dot | ||
| line |
so the dot-to-line score is , whatever is. The same substitution with the shipped gives : in 2-D, in 3-D — always greater than one, always the wrong way round.
def volume_dot_and_line(width, sigma, size):
    """The same picture in 3-D: a tube along the last axis, and a ball."""
    amp = np.sqrt(1 + sigma**2 / width**2)
    zz, yy, xx = np.indices((size,) * 3, dtype=float)
    dot_at, line_at = (18, 18, 46), (46, 46, 18)
    tube = np.exp(-((zz - 46) ** 2 + (yy - 46) ** 2) / (2 * width**2))
    ball = amp * np.exp(-((zz - 18) ** 2 + (yy - 18) ** 2 + (xx - 46) ** 2)
                        / (2 * width**2))
    return tube + ball, dot_at, line_at


VOLUME, DOT_3D, LINE_3D = volume_dot_and_line(3.0, 3.0, 65)

table = []
for n, (image, sigma, at) in {
    2: (SCENE, SIGMA, (DOT_AT, LINE_AT)),
    3: (VOLUME, 3.0, (DOT_3D, LINE_3D)),
}.items():
    for name, alpha in (("documented, −1/(n+1)", -1 / (n + 1)),
                        ("shipped, +1/(n+1)", +1 / (n + 1))):
        dot, line = scores(image, alpha, sigma=sigma,
                           dot_at=at[0], line_at=at[1])
        predicted = (1 + (n - 1) * alpha) / (1 + (n - 2) * alpha)
        table.append({"n": n, "alpha": name, "dot / line": round(dot / line, 6),
                      "predicted": round(predicted, 6),
                      "difference": f"{abs(dot / line - predicted):.1e}"})
show_table(pd.DataFrame(table), index=["n", "alpha"])The residual is at the last bit of double precision in every row, and the documented column is in both dimensions.
4.1 Do not parametrise this test past 3-D¶
The line’s score above assumed the filter still reads the across-line bending rather than the along-line one. That holds while exceeds , which at means . So is an exact tie, decided by rounding, and from the filter reads the flat direction instead — where the bending has the opposite sign, and is clipped away.
# 5-D, on a deliberately small grid: the claim is that the line reads zero,
# and that needs no room to show.
idx = np.indices((11,) * 5, dtype=float)
line_5d = np.exp(-sum((idx[k] - 7.0) ** 2 for k in range(4)) / (2 * 1.2**2))
dot_5d = np.sqrt(2) * np.exp(-sum((idx[k] - 3.0) ** 2 for k in range(5))
                             / (2 * 1.2**2))
scene_5d = line_5d + dot_5d

show_table(pd.DataFrame(
    [{"alpha": name,
      "dot": meijering(scene_5d, sigmas=[1.2], alpha=a,
                       black_ridges=False)[(3,) * 5],
      "line": meijering(scene_5d, sigmas=[1.2], alpha=a,
                        black_ridges=False)[(7, 7, 7, 7, 5)]}
     for name, a in (("α = 0", 0.0), ("α = −1/6, documented", -1 / 6))]
).round(6), index="alpha")In 5-D the documented value erases the line completely. That is a property of the filter, not of the test, but it decides how the test may be written: assert the ratio for and no further.
5. Test 3 — the dial is straight, and has two landmarks anyone can check¶
α is a continuous parameter, and the dot-to-line score follows it linearly. Two points on that line can be stated without any reference to the paper:
at the dot and the line tie — the shaping is off;
at the dot disappears entirely.
Between and beyond them the score is .
sweep = np.round(np.arange(-1.2, 1.21, 0.1), 4)
swept = np.array([scores(SCENE, a) for a in sweep])        # dot, line per alpha
with np.errstate(invalid="ignore"):                        # 0/0 below alpha=-1
    measured = swept[:, 0] / swept[:, 1]
predicted = np.abs(1 + sweep)

fig, ax = plt.subplots(figsize=(6.2, 3.1))
recede(ax, "dot-to-line score against α")
ax.plot(sweep, predicted, color=RULE, lw=4, label="|1 + α|", zorder=1)
ax.plot(sweep, measured, color=C_ONE, lw=1.4, marker="o", ms=3,
        label="measured", zorder=2)
ax.axhline(1.0, color=MUTED, lw=0.6, ls=":")
for a, name, colour in ((-1.0, "dot gone", C_THREE), (0.0, "tie", C_THREE),
                        (-1 / 3, "documented", C_TWO), (1 / 3, "shipped", C_TWO)):
    ax.plot([a], [abs(1 + a)], marker="o", ms=6, mfc="none", mec=colour)
    ax.annotate(name, xy=(a, abs(1 + a)), xytext=(0, 9),
                textcoords="offset points", ha="center", fontsize=8,
                color=colour)
ax.set_xlabel("α"); ax.set_ylabel("dot / line")
ax.legend(frameon=False, fontsize=8, loc="upper left")
fig.tight_layout()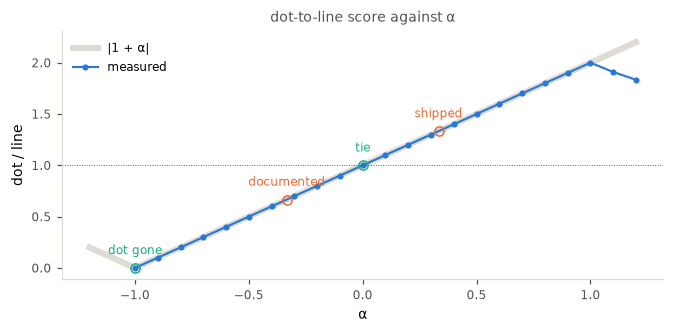
The measured curve leaves the prediction outside , in both directions, and it leaves it differently at the two ends. Below -1 the mixing has overwhelmed both structures: every score has been clipped to zero, so the ratio is and the curve has a gap rather than the rising arm the prediction shows. Above +1 only the line moves, and it moves the wrong way — its score turns back up instead of continuing to fall.
show_table(pd.DataFrame(
    [{"α": a, "dot": d, "line": l, "dot / line": m, "|1 + α|": p,
      "agrees": bool(abs(m - p) < 1e-8)}
     for a, (d, l), m, p in zip(sweep, swept, measured, predicted)
     if a in (-1.2, -1.1, -1.0, -0.5, 0.0, 0.5, 1.0, 1.1, 1.2)]
).round(8), index="α")So the test may sweep α, but only within , and that interval is not a
matter of taste: it is where the agrees column is true.
6. Test 4 — turning the picture must change nothing¶
An image rotated by 30° is the same image. A shaping constant that behaved differently for a diagonal line than for a vertical one would be a defect that none of the tests above would notice, because every structure so far has been aligned with an image axis.
angles = (0, 15, 30, 45, 63, 90)
rotated = {a: dot_and_line(amplitude=AMPLITUDE, angle=a) for a in angles}

fig, axes = plt.subplots(2, len(angles), figsize=(10.5, 3.7))
for col, angle in enumerate(angles):
    bare(axes[0, col], f"{angle}°")
    axes[0, col].imshow(rotated[angle], cmap="gray")
    out = meijering(rotated[angle], sigmas=[SIGMA], alpha=-1 / 3,
                    black_ridges=False)
    bare(axes[1, col])
    axes[1, col].imshow(out, cmap="gray", vmin=0, vmax=1)
axes[0, 0].set_ylabel("picture", color=MUTED, fontsize=8)
axes[1, 0].set_ylabel("α = −1/3", color=MUTED, fontsize=8)
fig.suptitle("the same test at six orientations", y=1.02)
fig.tight_layout()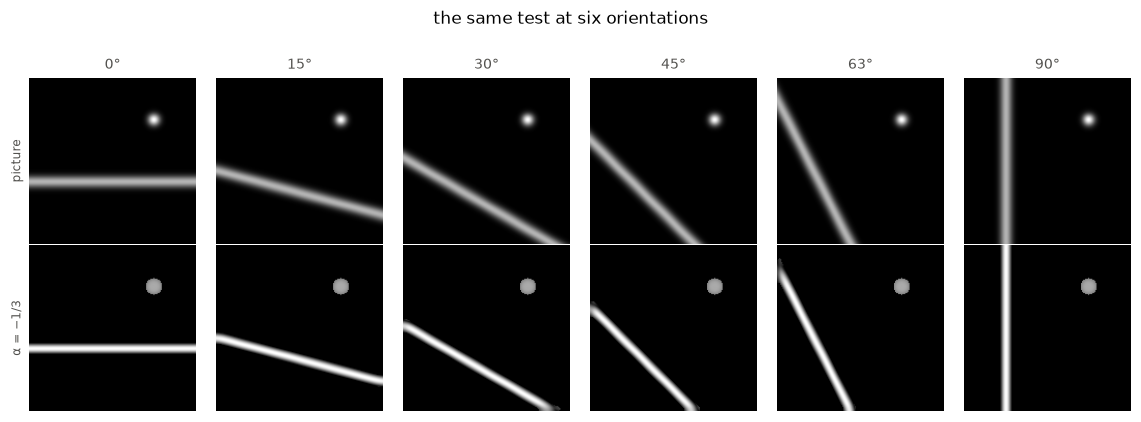
turned = pd.DataFrame(
    [{"angle": f"{a}°",
      "documented": np.divide(*scores(rotated[a], -1 / 3)),
      "shipped": np.divide(*scores(rotated[a], +1 / 3))}
     for a in angles]).set_index("angle")
show_table(pd.concat([turned.round(6),
                      turned.agg(np.ptp).to_frame("spread over angle").T
.map(lambda v: f"{v:.1e}")]), index=True)Both columns are constant across the six orientations: the spread in the last row is 10-16, the width of a rounding error. The assertion is therefore as tight as the axis-aligned one, and it is worth keeping separate: it is the only test here that would catch an implementation whose shaping leaked into the orientation.
A caution on how the rotated picture is built. The line above is with a linear function of the coordinates — an exact profile at every angle. A line drawn by thresholding, or rasterised from a polygon, is not: §7.3 measures what that costs.
7. Test 5 — the default must be the number the docstring names¶
The four tests so far are about behaviour, and all four need a picture. The fifth needs nothing at all, catches the same bug, and is the one to write first.
def default_matches(ndim, sign):
    """Is `alpha=None` bit-identical to `alpha = sign/(ndim+1)`?"""
    rng = np.random.default_rng(0)
    image = ndi.gaussian_filter(rng.random((32,) * ndim), 1.5)
    default = meijering(image, sigmas=[2.0])
    explicit = meijering(image, sigmas=[2.0], alpha=sign / (ndim + 1))
    return np.array_equal(default, explicit), np.abs(default - explicit).max()


show_table(pd.DataFrame(
    [{"ndim": n,
      "default is −1/(n+1)": default_matches(n, -1)[0],
      "default is +1/(n+1)": default_matches(n, +1)[0],
      "max difference from −1/(n+1)": default_matches(n, -1)[1]}
for n in (2, 3)]).round(4), index="ndim")alpha=None is bit-identical to the positive value and differs from the
documented one by up to 0.46 of the output range in 2-D. The test is an exact
equality — atol=0, rtol=0 — because the two calls differ only in a constant
that the caller supplied, so there is no floating-point slack to allow for.
Both dimensions must appear, because the default is a function of ndim and a
2-D check says nothing about the 3-D branch. Smooth random noise is the right
input here precisely because the test makes no claim about structures.
One more equality is free, and guards the same code path from the other side:
show_table(pd.DataFrame(
    [{"α": f"{a:+.4f}",
      "bright-on-dark == dark-on-bright":
          str(np.array_equal(
              meijering(SCENE, sigmas=[SIGMA], alpha=a, black_ridges=False),
              meijering(-SCENE, sigmas=[SIGMA], alpha=a)))}
for a in (0.0, -1 / 3, 1 / 3)]), index="α")The polarity switch is exact, so α cannot be interacting with it.
8. What the test picture has to avoid¶
Three ways to build the picture wrongly. Each degrades the same measurement — the dot-to-line score at , whose exact value is — so the size of each mistake is directly comparable.
def contrast(image, dot_at=DOT_AT, line_at=LINE_AT, sigma=SIGMA):
    """Dot-to-line score at the documented α. Exactly 2/3 on a clean picture."""
    return np.divide(*scores(image, -1 / 3, sigma=sigma,
                             dot_at=dot_at, line_at=line_at))
8.1 The structures need room from each other¶
Each structure’s blur reaches into its neighbour and bends it slightly the wrong way. The dot stops being round, and the stops being exact.
gaps = (40, 30, 24, 20, 16, 12)
gap_err = []
for gap in gaps:
    at = (100 - gap, 120)
    image = (np.exp(-((rows - 100) ** 2) / (2 * WIDTH**2))
             + AMPLITUDE * np.exp(-((rows - at[0]) ** 2 + (cols - 120) ** 2)
                                  / (2 * WIDTH**2)))
    gap_err.append(abs(contrast(image, dot_at=at, line_at=(100, 40)) - 2 / 3))
8.2 The structures need room from the frame¶
mode='reflect' invents what lies outside the picture, and near the border what
it invents has curvature the structure does not have.
margins = (40, 20, 12, 8, 5, 3)
margin_err = []
for margin in margins:
    image = dot_and_line(amplitude=AMPLITUDE, angle=30,
                         line_at=(margin, 60), dot_at=(margin, 130))
    margin_err.append(abs(contrast(image, dot_at=(margin, 130),
                                   line_at=(margin, 60)) - 2 / 3))

fig, ax = plt.subplots(figsize=(6.2, 3.1))
recede(ax, "error in the dot-to-line score, against room given")
ax.semilogy(np.array(gaps) / WIDTH, gap_err, color=C_ONE, marker="o", ms=4,
            label="gap between structures, in widths")
ax.semilogy(np.array(margins) / SIGMA, margin_err, color=C_TWO, marker="s",
            ms=4, label="margin to the frame, in σ")
ax.axhline(1e-6, color=MUTED, lw=0.6, ls=":")
ax.annotate("tolerance used below", xy=(7.5, 1e-6), xytext=(0, 4),
            textcoords="offset points", fontsize=8, color=MUTED, ha="right")
ax.set_xlabel("room, in units of the structure's own scale")
ax.set_ylabel("|measured − 2/3|")
ax.legend(frameon=False, fontsize=8)
fig.tight_layout()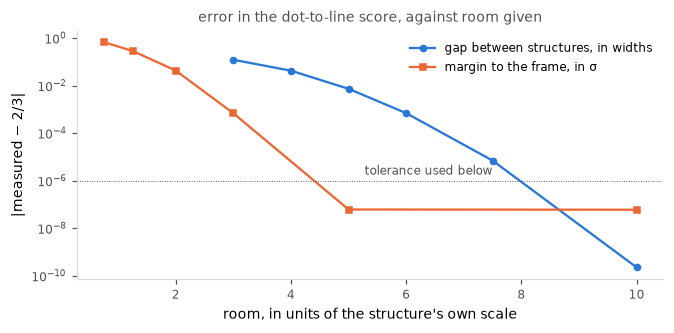
Ten widths between the structures, and five σ from the structures to the frame, both put the error below 10-7. Four widths, or two σ, put it above . A test that crowds its picture and then loosens its tolerance to compensate has stopped testing α.
8.3 The shapes must be profiles, not rasterisations¶
A bar produced by thresholding has a hard edge that the blur turns into a second curvature, so the line is no longer flat along itself. It also has a different peak curvature from a Gaussian of the same width, which breaks the matching of §2. Both show up, at very different sizes.
across = (rows - 100) * np.cos(np.deg2rad(30)) - (cols - 40) * np.sin(np.deg2rad(30))
dot_only = AMPLITUDE * np.exp(-((rows - 40) ** 2 + (cols - 120) ** 2)
                              / (2 * WIDTH**2))
built = {
    "exp(−d²/2w²) profile": np.exp(-across**2 / (2 * WIDTH**2)) + dot_only,
    "|d| < w, thresholded": (np.abs(across) < WIDTH).astype(float) + dot_only,
}
show_table(pd.DataFrame(
    [{"how the line is drawn": name,
      "dot / line at α = 0": np.divide(*scores(image, 0.0)),
      "dot / line at α = −1/3": contrast(image),
      "after dividing out the α = 0 column":
          contrast(image) / np.divide(*scores(image, 0.0))}
for name, image in built.items()]).round(8), index="how the line is drawn")The first column is the matching test 1 depends on: the profile ties at 1.000000
and the bar does not tie at all, so the second column is 0.487 rather than
for a reason that has nothing to do with α. Dividing the α out leaves a
residue of , which is the part that really is a loss of
flatness. So a rasterised shape fails the sharp test for the wrong reason, and
fails a rtol=5e-2 test for the right one only after you have hidden the wrong
one. Use the exact profile: it costs nothing.
8.4 Choose the tolerance from the picture, not from habit¶
Every quantity asserted here has an exact value: , , bit
equality. On a picture built as §8.1 to §8.3 require, the measured departure
from those values is below 10-8 everywhere — §4 and §6 are at 10-16,
the width of a rounding error — so rtol=1e-6 is safe with orders to spare. A
generic rtol=5e-2 would pass a dot-to-line score of 0.7, which corresponds
to : a value no correct implementation produces.
9. The suite¶
Five tests, each named for the sentence it asserts. They run below against the
installed skimage.
SUITE_SIGMA, SUITE_WIDTH = 4.0, 4.0


def suite_picture(angle=0.0):
    """The shared picture: a dot and a line the filter ties at α = 0."""
    return dot_and_line(width=SUITE_WIDTH, sigma=SUITE_SIGMA, angle=angle,
                        amplitude=np.sqrt(1 + SUITE_SIGMA**2 / SUITE_WIDTH**2))


def suite_ratio(image, alpha, sigma=SUITE_SIGMA, dot_at=DOT_AT, line_at=LINE_AT):
    """Dot score over line score, in one picture, so the /max cancels."""
    out = meijering(image, sigmas=[sigma], alpha=alpha, black_ridges=False)
    return out[dot_at] / out[line_at]
def test_a_line_beats_a_dot():
"""The default must rank an elongated structure above a blob."""
image = suite_picture()
assert abs(suite_ratio(image, 0.0) - 1.0) < 1e-6, "picture is not matched"
assert suite_ratio(image, None) < 1.0
def test_the_dot_scores_two_thirds_of_the_line():
"""The default puts the dot at exactly 2/3 of the line, in 2-D and in 3-D."""
image = suite_picture()
assert abs(suite_ratio(image, None) - 2 / 3) < 1e-6
volume, dot_at, line_at = volume_dot_and_line(3.0, 3.0, 65)
assert abs(suite_ratio(volume, None, sigma=3.0, dot_at=dot_at,
line_at=line_at) - 2 / 3) < 1e-6
def test_the_dial_is_linear_between_its_landmarks():
"""dot/line is |1+alpha|: a tie at alpha=0, and no dot at alpha=-1."""
image = suite_picture()
for alpha in np.linspace(-1.0, 1.0, 9):
assert abs(suite_ratio(image, alpha) - abs(1 + alpha)) < 1e-6
assert suite_ratio(image, -1.0) == 0.0
def test_orientation_does_not_matter():
"""The same dot and line, turned, must give the same answer."""
straight = suite_ratio(suite_picture(0), -1 / 3)
for angle in (15, 30, 45, 63, 90):
assert abs(suite_ratio(suite_picture(angle), -1 / 3) - straight) < 1e-6
def test_the_default_is_the_documented_value():
"""alpha=None must be exactly -1/(ndim+1), in every dimension."""
for ndim in (2, 3):
rng = np.random.default_rng(0)
image = ndi.gaussian_filter(rng.random((32,) * ndim), 1.5)
assert np.array_equal(
meijering(image, sigmas=[2.0]),
meijering(image, sigmas=[2.0], alpha=-1 / (ndim + 1)))SUITE = [test_a_line_beats_a_dot,
test_the_dot_scores_two_thirds_of_the_line,
test_the_dial_is_linear_between_its_landmarks,
test_orientation_does_not_matter,
test_the_default_is_the_documented_value]
results = []
for test in SUITE:
try:
test()
outcome = "pass"
except AssertionError as exc:
outcome = f"FAIL{': ' + str(exc) if str(exc) else ''}"
results.append({"test": test.__name__.removeprefix("test_").replace("_", " "),
"asserts": test.__doc__.splitlines()[0],
"installed skimage": outcome})
show_table(pd.DataFrame(results), index="test")Three of the five fail on the installed release, and the two that pass are the two that say nothing about the sign: the dial is linear whatever its default is, and orientation is irrelevant whatever its default is. Those two are still worth having — they fence in the behaviour that the fix must not disturb — but the first, second and fifth are the ones that catch the bug.
The suite in ../meijering-alpha-fix covers the first, second and fifth of
these in two functions, and has neither the α sweep nor the orientation check.
Splitting it as above buys a failure message that names the broken promise: a
suite in which test_a_line_beats_a_dot goes red says what went wrong without
anyone reading the assertion.
10. Summary¶
| test | the sentence it asserts | why it is justified |
|---|---|---|
| a line beats a dot | on a picture the filter ties at α = 0, the default must put the line higher | the docstring’s own words |
| the dot scores two thirds | that ratio is exactly 2/3, in 2-D and in 3-D | over , §4 |
| the dial is linear | dot/line is on ; tie at 0, dot gone at −1 | two landmarks, checkable by eye |
| orientation does not matter | the same answer at six angles | a turned picture is the same picture |
| the default is documented | alpha=None is bit-identical to | the docstring names a number |
and the three rules the picture must obey: both structures in one frame (§1), ten widths apart and five σ from the border (§8.1, §8.2), drawn as exact profiles rather than thresholds (§8.3).
Limits. Every picture here is synthetic, noise-free, and filtered at one σ
matched to the structure width; nothing is measured on a real image, and the
multi-scale maximum over several σ is not exercised. The exact ratios hold for
structures that are exact functions of a single linear coordinate, which is what
§8.3 is about; a curved or finite-length line is not one of those and is not
covered. The dimension law is measured at and , and §4.1 shows
it fails from ; is an exact tie and is untested here. The mode
argument is left at its default throughout, so the border measurement in §8.2
describes reflect only.
print(f"scikit-image {ski.__version__}")scikit-image 0.26.1rc0.dev0