Note
Go to the end to download the full example code or to run this example in your browser via Binder
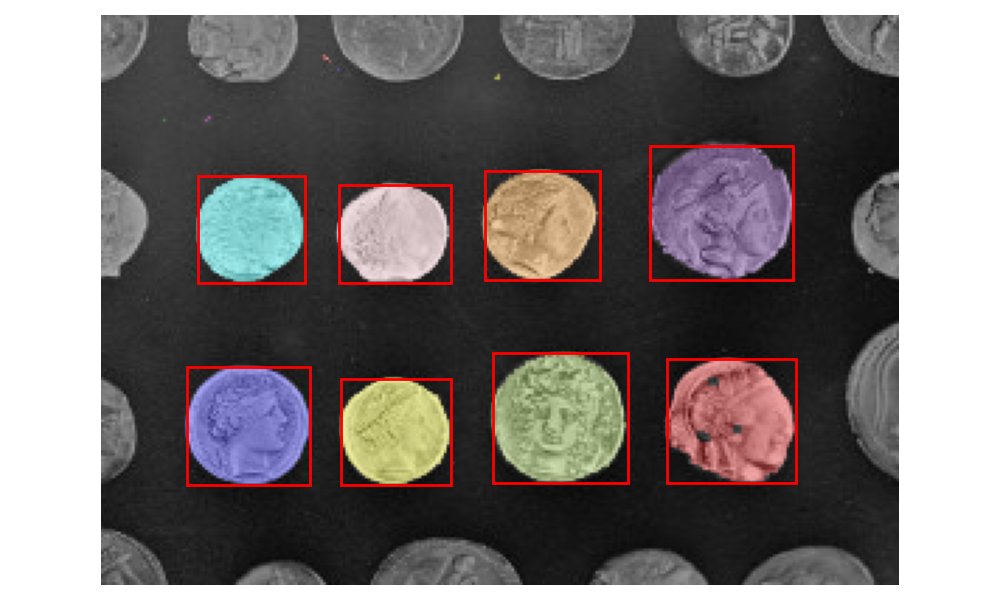
Label image regions#
This example shows how to segment an image with image labelling. The following steps are applied:
Thresholding with automatic Otsu method
Close small holes with binary closing
Remove artifacts touching image border
Measure image regions to filter small objects
import matplotlib.pyplot as plt
import matplotlib.patches as mpatches

from skimage import data
from skimage.filters import threshold_otsu
from skimage.segmentation import clear_border
from skimage.measure import label, regionprops
from skimage.morphology import closing, square
from skimage.color import label2rgb


image = data.coins()[50:-50, 50:-50]

# apply threshold
thresh = threshold_otsu(image)
bw = closing(image > thresh, square(3))

# remove artifacts connected to image border
cleared = clear_border(bw)

# label image regions
label_image = label(cleared)
# to make the background transparent, pass the value of `bg_label`,
# and leave `bg_color` as `None` and `kind` as `overlay`
image_label_overlay = label2rgb(label_image, image=image, bg_label=0)

fig, ax = plt.subplots(figsize=(10, 6))
ax.imshow(image_label_overlay)

for region in regionprops(label_image):
    # take regions with large enough areas
    if region.area >= 100:
        # draw rectangle around segmented coins
        minr, minc, maxr, maxc = region.bbox
        rect = mpatches.Rectangle((minc, minr), maxc - minc, maxr - minr,
                                  fill=False, edgecolor='red', linewidth=2)
        ax.add_patch(rect)

ax.set_axis_off()
plt.tight_layout()
plt.show()
Total running time of the script: ( 0 minutes 2.018 seconds)