Note
Go to the end to download the full example code or to run this example in your browser via Binder
Estimate strength of blur#
This example shows how the metric implemented in measure.blur_effect
behaves, both as a function of the strength of blur and of the size of the
re-blurring filter. This no-reference perceptual blur metric is described in
[1].
import matplotlib.pyplot as plt
import numpy as np
import pandas as pd
import scipy.ndimage as ndi

import plotly
import plotly.express as px
from skimage import (
    color, data, measure
)
Generate series of increasingly blurred images#
Let us load an image available through scikit-image’s data registry. The blur metric applies to single-channel images.
image = data.astronaut()
image = color.rgb2gray(image)
Let us blur this image with a series of uniform filters of increasing size.
blurred_images = [ndi.uniform_filter(image, size=k) for k in range(2, 32, 2)]
img_stack = np.stack(blurred_images)

fig = px.imshow(
    img_stack,
    animation_frame=0,
    binary_string=True,
    labels={'animation_frame': 'blur strength ~'}
)
plotly.io.show(fig)
Plot blur metric#
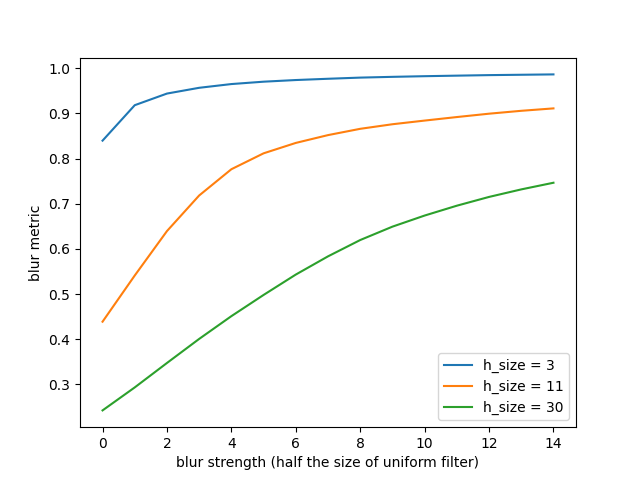
Let us compute the blur metric for all blurred images: We expect it to increase towards 1 with increasing blur strength. We compute it for three different values of re-blurring filter: 3, 11 (default), and 30.
B = pd.DataFrame(
    data=np.zeros((len(blurred_images), 3)),
    columns=['h_size = 3', 'h_size = 11', 'h_size = 30']
)
for ind, im in enumerate(blurred_images):
    B.loc[ind, 'h_size = 3'] = measure.blur_effect(im, h_size=3)
    B.loc[ind, 'h_size = 11'] = measure.blur_effect(im, h_size=11)
    B.loc[ind, 'h_size = 30'] = measure.blur_effect(im, h_size=30)

B.plot().set(xlabel='blur strength (half the size of uniform filter)',
             ylabel='blur metric')

plt.show()

We can see that as soon as the blur is stronger than (reaches the scale of)
the size of the uniform filter, the metric gets close to 1 and, hence, tends
asymptotically to 1 with increasing blur strength.
The value of 11 pixels gives a blur metric which correlates best with human
perception. That’s why it’s the default value in the implementation of the
perceptual blur metric measure.blur_effect.
Total running time of the script: ( 0 minutes 2.191 seconds)