Note
Go to the end to download the full example code or to run this example in your browser via Binder
Specific images#
import matplotlib.pyplot as plt
import matplotlib

from skimage import data

matplotlib.rcParams["font.size"] = 18
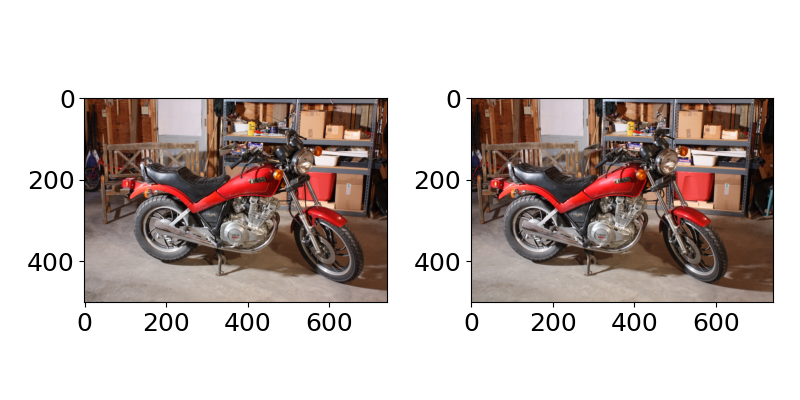
Stereo images#
fig, axes = plt.subplots(1, 2, figsize=(8, 4))
ax = axes.ravel()

cycle_images = data.stereo_motorcycle()
ax[0].imshow(cycle_images[0])
ax[1].imshow(cycle_images[1])

fig.tight_layout()
plt.show()
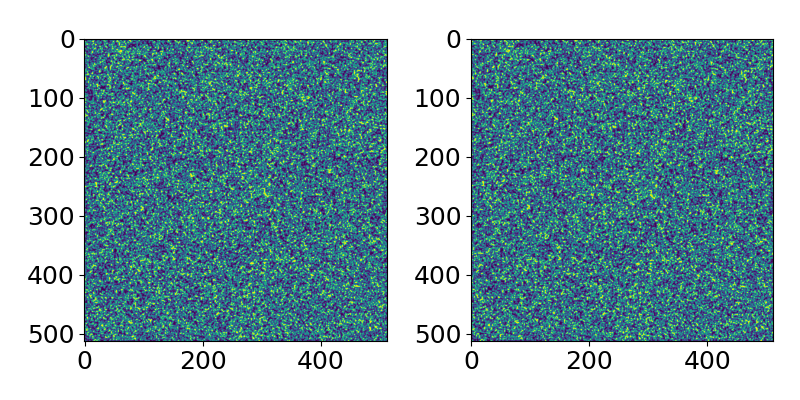
PIV images#
fig, axes = plt.subplots(1, 2, figsize=(8, 4))
ax = axes.ravel()

vortex_images = data.vortex()
ax[0].imshow(vortex_images[0])
ax[1].imshow(vortex_images[1])

fig.tight_layout()
plt.show()
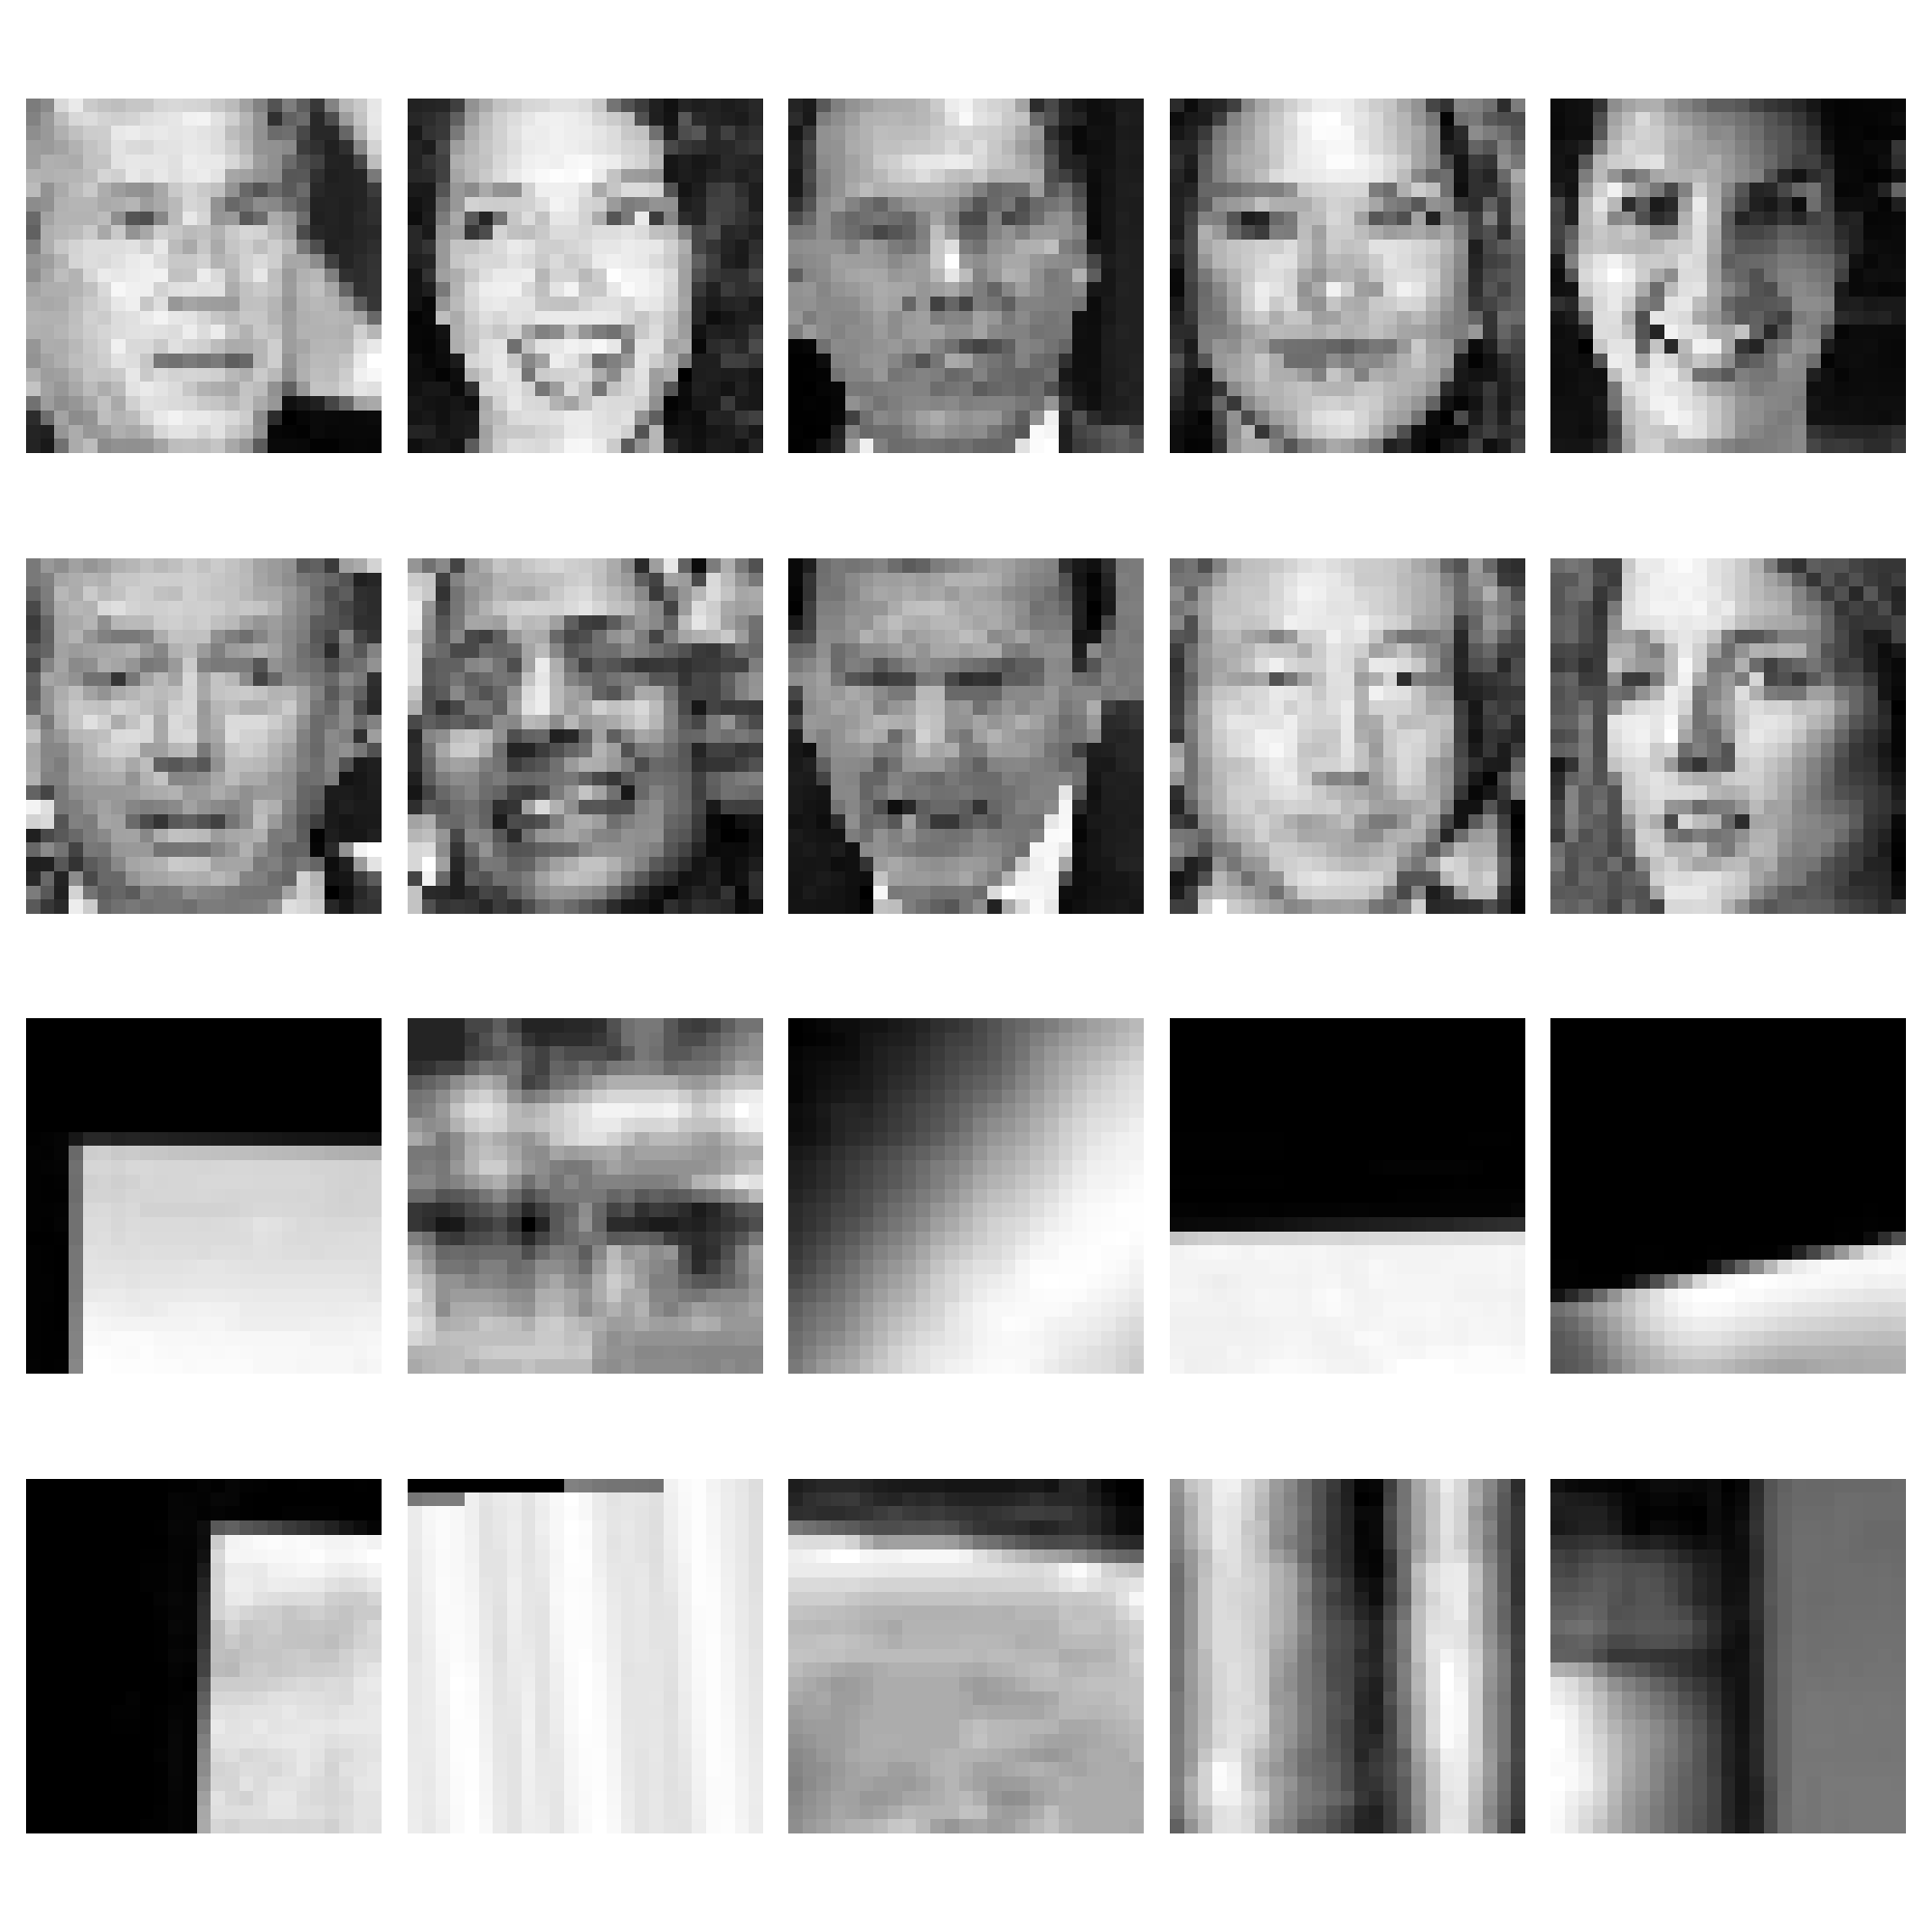
Faces and non-faces dataset#
A sample of 20 over 200 images is displayed.
fig, axes = plt.subplots(4, 5, figsize=(20, 20))
ax = axes.ravel()
lfw_images = data.lfw_subset()
for i in range(20):
    ax[i].imshow(lfw_images[90 + i], cmap=plt.cm.gray)
    ax[i].axis("off")
fig.tight_layout()
plt.show()
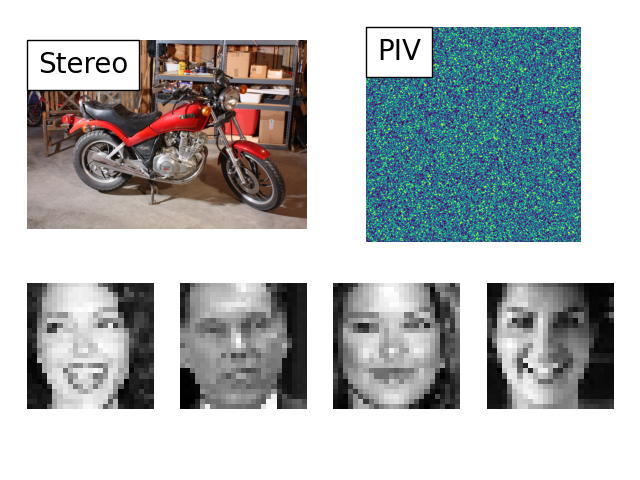
Thumbnail image for the gallery
from matplotlib.offsetbox import AnchoredText

# Create a gridspec with two images in the first and 4 in the second row
fig, axd = plt.subplot_mosaic(
    [["stereo", "stereo", "piv", "piv"], ["lfw0", "lfw1", "lfw2", "lfw3"]],
)
axd["stereo"].imshow(cycle_images[0])
axd["stereo"].add_artist(
    AnchoredText(
        "Stereo",
        prop=dict(size=20),
        frameon=True,
        borderpad=0,
        loc="upper left",
    )
)
axd["piv"].imshow(vortex_images[0])
axd["piv"].add_artist(
    AnchoredText(
        "PIV",
        prop=dict(size=20),
        frameon=True,
        borderpad=0,
        loc="upper left",
    )
)
axd["lfw0"].imshow(lfw_images[91], cmap="gray")
axd["lfw1"].imshow(lfw_images[92], cmap="gray")
axd["lfw2"].imshow(lfw_images[93], cmap="gray")
axd["lfw3"].imshow(lfw_images[94], cmap="gray")

for ax in axd.values():
    ax.axis("off")
fig.tight_layout()
plt.show()
Total running time of the script: ( 0 minutes 2.592 seconds)