Note
Go to the end to download the full example code or to run this example in your browser via Binder
Chan-Vese Segmentation#
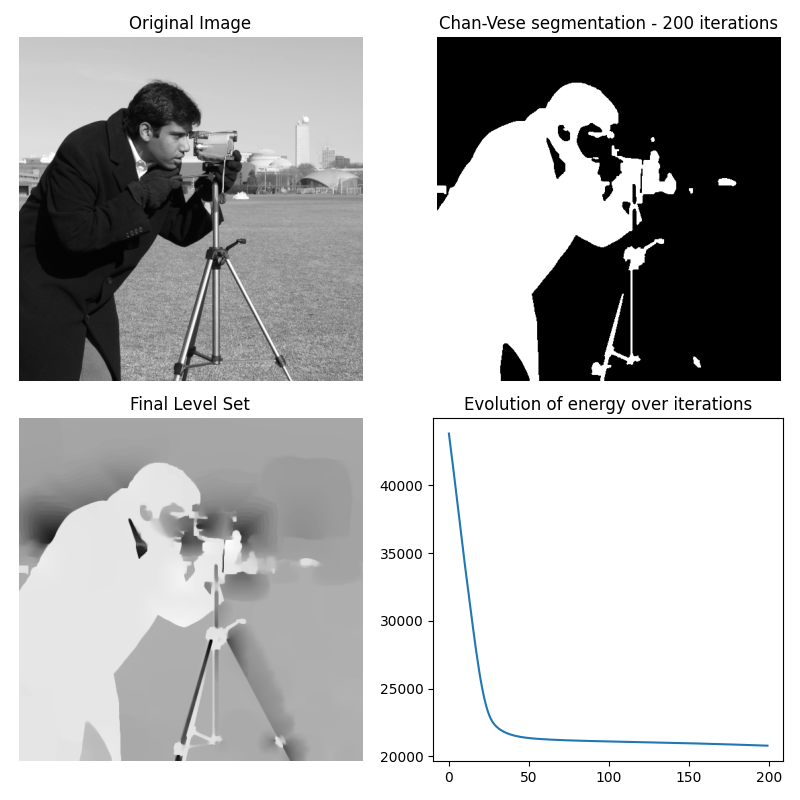
The Chan-Vese segmentation algorithm is designed to segment objects without clearly defined boundaries. This algorithm is based on level sets that are evolved iteratively to minimize an energy, which is defined by weighted values corresponding to the sum of differences intensity from the average value outside the segmented region, the sum of differences from the average value inside the segmented region, and a term which is dependent on the length of the boundary of the segmented region.
This algorithm was first proposed by Tony Chan and Luminita Vese, in a publication entitled “An Active Contour Model Without Edges” [1]. See also [2], [3].
This implementation of the algorithm is somewhat simplified in the sense that the area factor ‘nu’ described in the original paper is not implemented, and is only suitable for grayscale images.
Typical values for lambda1 and lambda2 are 1. If the ‘background’ is
very different from the segmented object in terms of distribution (for
example, a uniform black image with figures of varying intensity), then
these values should be different from each other.
Typical values for mu are between 0 and 1, though higher values can be
used when dealing with shapes with very ill-defined contours.
The algorithm also returns a list of values that corresponds to the energy at each iteration. This can be used to adjust the various parameters described above.
References#

import matplotlib.pyplot as plt
from skimage import data, img_as_float
from skimage.segmentation import chan_vese

image = img_as_float(data.camera())
# Feel free to play around with the parameters to see how they impact the result
cv = chan_vese(image, mu=0.25, lambda1=1, lambda2=1, tol=1e-3,
               max_num_iter=200, dt=0.5, init_level_set="checkerboard",
               extended_output=True)

fig, axes = plt.subplots(2, 2, figsize=(8, 8))
ax = axes.flatten()

ax[0].imshow(image, cmap="gray")
ax[0].set_axis_off()
ax[0].set_title("Original Image", fontsize=12)

ax[1].imshow(cv[0], cmap="gray")
ax[1].set_axis_off()
title = f'Chan-Vese segmentation - {len(cv[2])} iterations'
ax[1].set_title(title, fontsize=12)

ax[2].imshow(cv[1], cmap="gray")
ax[2].set_axis_off()
ax[2].set_title("Final Level Set", fontsize=12)

ax[3].plot(cv[2])
ax[3].set_title("Evolution of energy over iterations", fontsize=12)

fig.tight_layout()
plt.show()
Total running time of the script: ( 0 minutes 5.644 seconds)