Note
Go to the end to download the full example code or to run this example in your browser via Binder
Thresholding#
Thresholding is used to create a binary image from a grayscale image [1].
See also
A more comprehensive presentation on Thresholding
import matplotlib.pyplot as plt
from skimage import data
from skimage.filters import threshold_otsu
We illustrate how to apply one of these thresholding algorithms. Otsu’s method [2] calculates an “optimal” threshold (marked by a red line in the histogram below) by maximizing the variance between two classes of pixels, which are separated by the threshold. Equivalently, this threshold minimizes the intra-class variance.
image = data.camera()
thresh = threshold_otsu(image)
binary = image > thresh

fig, axes = plt.subplots(ncols=3, figsize=(8, 2.5))
ax = axes.ravel()
ax[0] = plt.subplot(1, 3, 1)
ax[1] = plt.subplot(1, 3, 2)
ax[2] = plt.subplot(1, 3, 3, sharex=ax[0], sharey=ax[0])

ax[0].imshow(image, cmap=plt.cm.gray)
ax[0].set_title('Original')
ax[0].axis('off')

ax[1].hist(image.ravel(), bins=256)
ax[1].set_title('Histogram')
ax[1].axvline(thresh, color='r')

ax[2].imshow(binary, cmap=plt.cm.gray)
ax[2].set_title('Thresholded')
ax[2].axis('off')

plt.show()

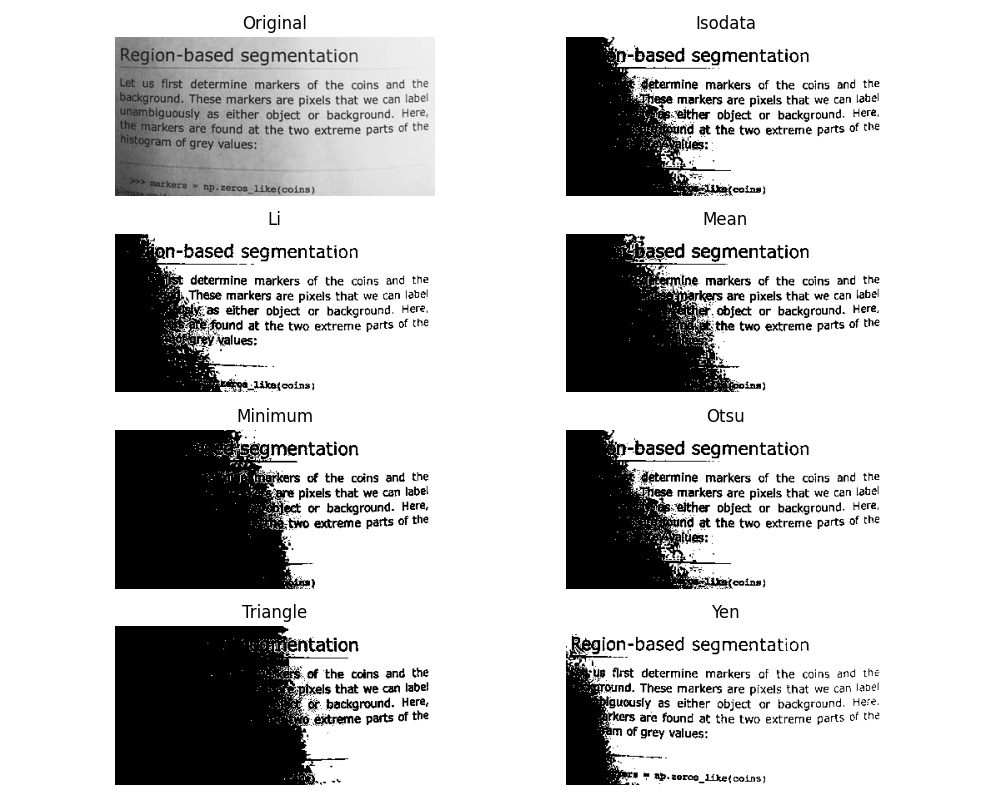
If you are not familiar with the details of the different algorithms and the underlying assumptions, it is often difficult to know which algorithm will give the best results. Therefore, Scikit-image includes a function to evaluate thresholding algorithms provided by the library. At a glance, you can select the best algorithm for your data without a deep understanding of their mechanisms.
from skimage.filters import try_all_threshold

img = data.page()

fig, ax = try_all_threshold(img, figsize=(10, 8), verbose=False)
plt.show()

Total running time of the script: (0 minutes 1.622 seconds)