Note
Go to the end to download the full example code or to run this example in your browser via Binder
Multi-Otsu Thresholding#
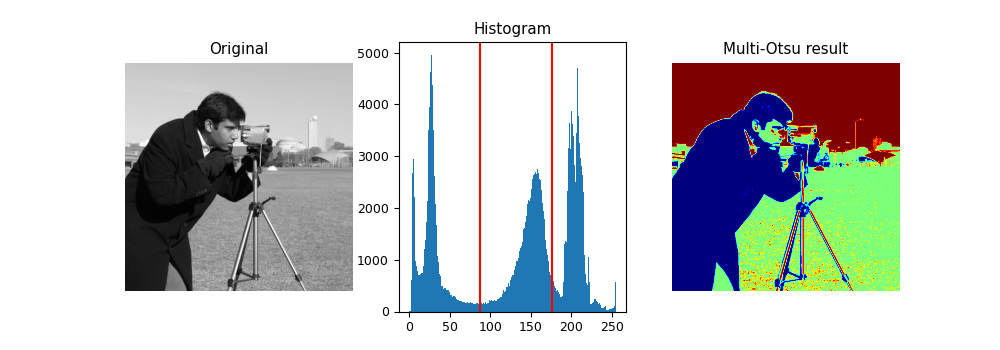
The multi-Otsu threshold [1] is a thresholding algorithm that is used to separate the pixels of an input image into several different classes, each one obtained according to the intensity of the gray levels within the image.
Multi-Otsu calculates several thresholds, determined by the number of desired classes. The default number of classes is 3: for obtaining three classes, the algorithm returns two threshold values. They are represented by a red line in the histogram below.

import matplotlib
import matplotlib.pyplot as plt
import numpy as np

from skimage import data
from skimage.filters import threshold_multiotsu

# Setting the font size for all plots.
matplotlib.rcParams['font.size'] = 9

# The input image.
image = data.camera()

# Applying multi-Otsu threshold for the default value, generating
# three classes.
thresholds = threshold_multiotsu(image)

# Using the threshold values, we generate the three regions.
regions = np.digitize(image, bins=thresholds)

fig, ax = plt.subplots(nrows=1, ncols=3, figsize=(10, 3.5))

# Plotting the original image.
ax[0].imshow(image, cmap='gray')
ax[0].set_title('Original')
ax[0].axis('off')

# Plotting the histogram and the two thresholds obtained from
# multi-Otsu.
ax[1].hist(image.ravel(), bins=255)
ax[1].set_title('Histogram')
for thresh in thresholds:
    ax[1].axvline(thresh, color='r')

# Plotting the Multi Otsu result.
ax[2].imshow(regions, cmap='jet')
ax[2].set_title('Multi-Otsu result')
ax[2].axis('off')

plt.subplots_adjust()

plt.show()
Total running time of the script: (0 minutes 0.717 seconds)