Note
Go to the end to download the full example code or to run this example in your browser via Binder
Scientific images#
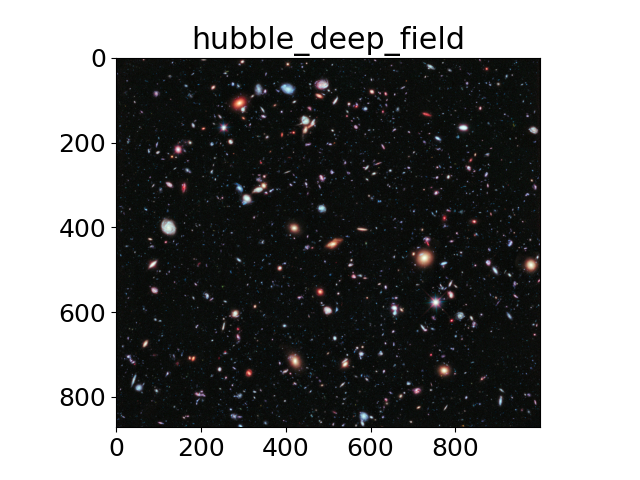
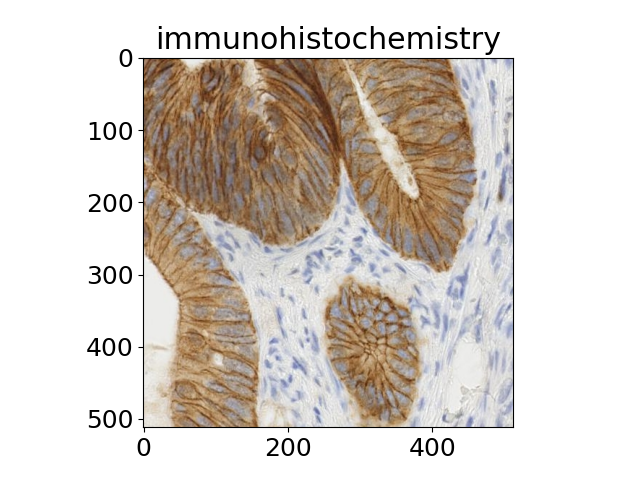
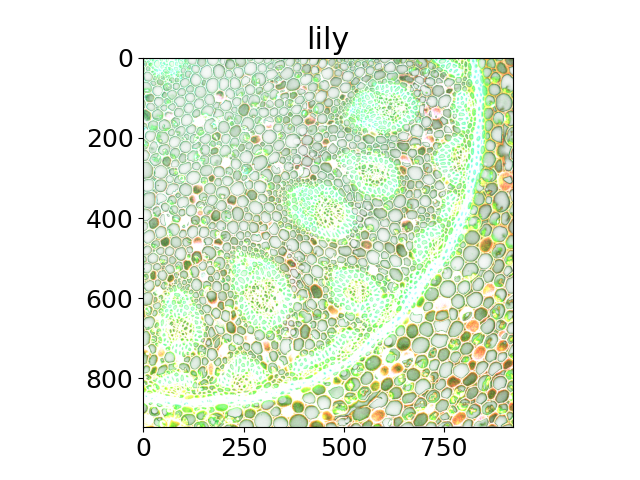
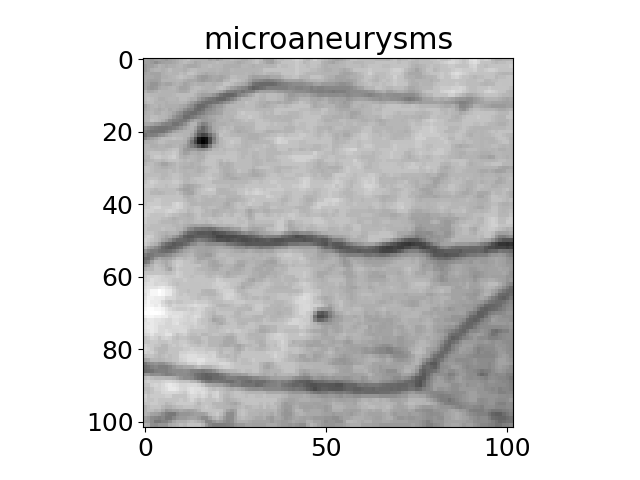
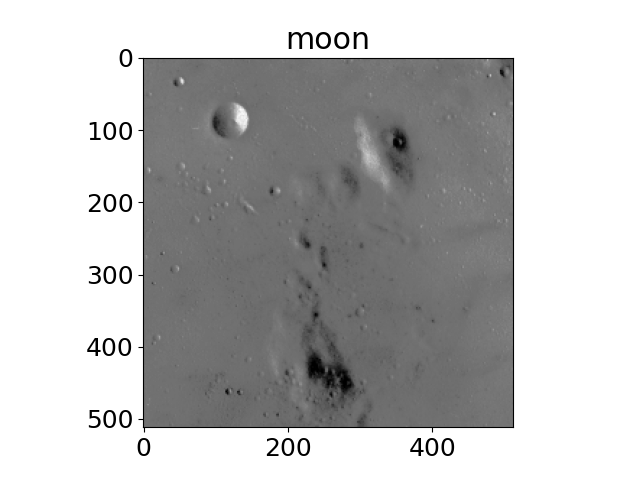
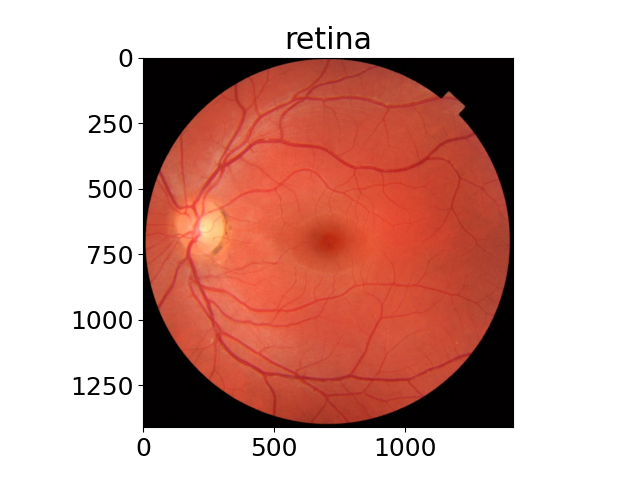
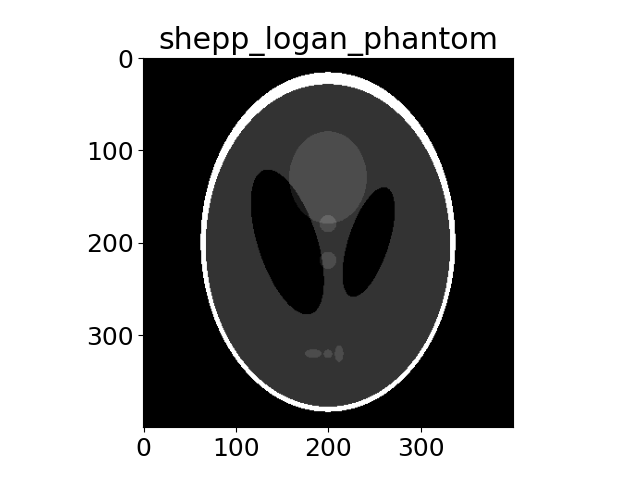
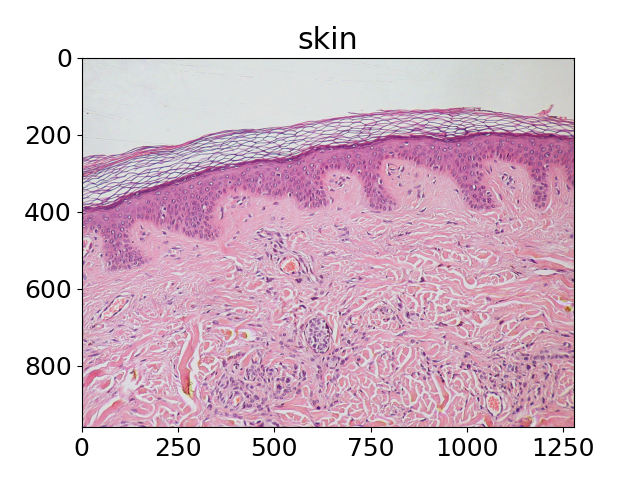
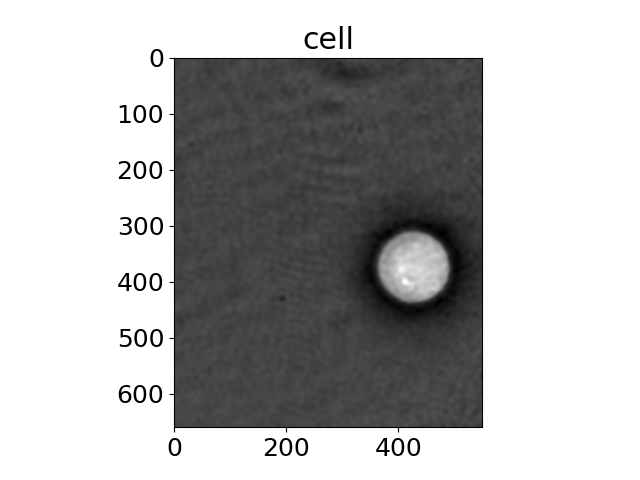
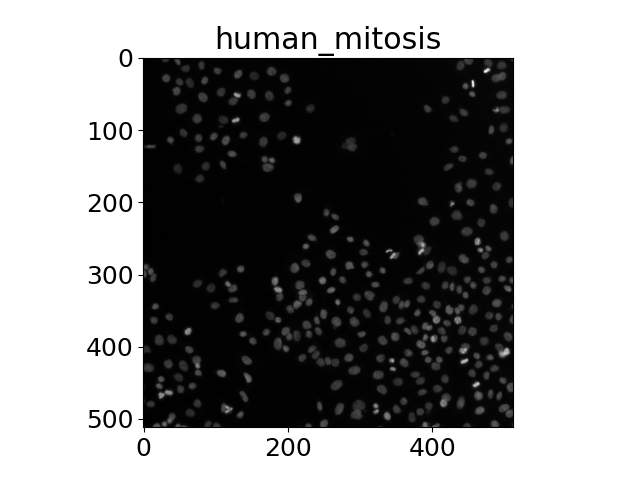
The title of each image indicates the name of the function.
import matplotlib.pyplot as plt
import matplotlib
import numpy as np

from skimage import data

matplotlib.rcParams['font.size'] = 18

images = (
    'hubble_deep_field',
    'immunohistochemistry',
    'lily',
    'microaneurysms',
    'moon',
    'retina',
    'shepp_logan_phantom',
    'skin',
    'cell',
    'human_mitosis',
)


for name in images:
    caller = getattr(data, name)
    image = caller()
    plt.figure()
    plt.title(name)
    if image.ndim == 2:
        plt.imshow(image, cmap=plt.cm.gray)
    else:
        plt.imshow(image)

plt.show()
Clipping input data to the valid range for imshow with RGB data ([0..1] for floats or [0..255] for integers).
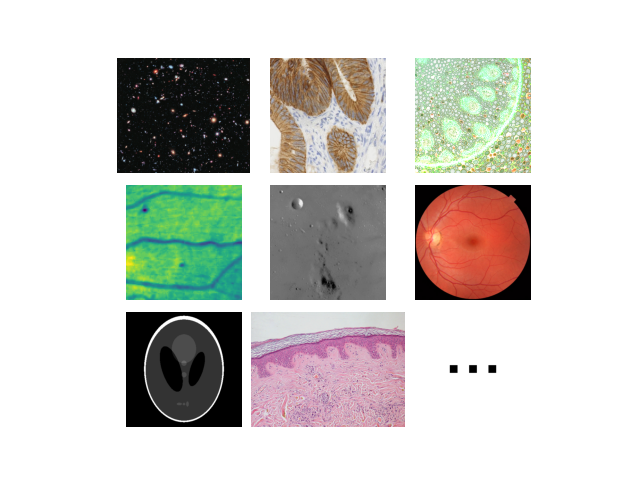
Thumbnail image for the gallery
fig, axs = plt.subplots(nrows=3, ncols=3)
for ax in axs.flat:
    ax.axis("off")
axs[0, 0].imshow(data.hubble_deep_field())
axs[0, 1].imshow(data.immunohistochemistry())
axs[0, 2].imshow(data.lily())
axs[1, 0].imshow(data.microaneurysms())
axs[1, 1].imshow(data.moon(), cmap=plt.cm.gray)
axs[1, 2].imshow(data.retina())
axs[2, 0].imshow(data.shepp_logan_phantom(), cmap=plt.cm.gray)
axs[2, 1].imshow(data.skin())
further_img = np.full((300, 300), 255)
for xpos in [100, 150, 200]:
    further_img[150 - 10 : 150 + 10, xpos - 10 : xpos + 10] = 0
axs[2, 2].imshow(further_img, cmap=plt.cm.gray)
plt.subplots_adjust(wspace=-0.3, hspace=0.1)
Clipping input data to the valid range for imshow with RGB data ([0..1] for floats or [0..255] for integers).
Total running time of the script: (0 minutes 3.821 seconds)