Note
Go to the end to download the full example code or to run this example in your browser via Binder
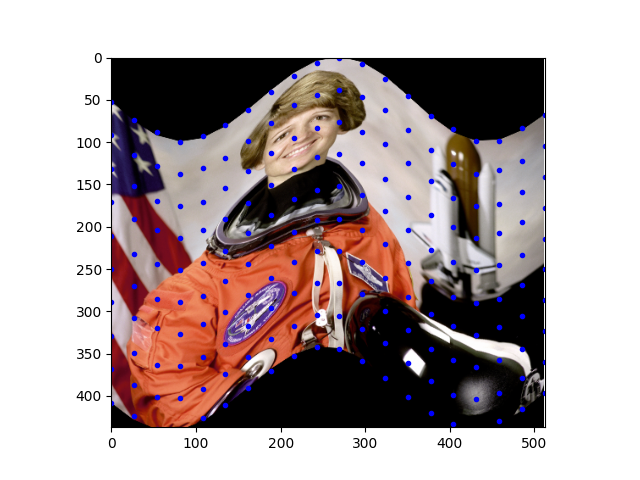
Piecewise Affine Transformation#
This example shows how to use the Piecewise Affine Transformation.
import numpy as np
import matplotlib.pyplot as plt
from skimage.transform import PiecewiseAffineTransform, warp
from skimage import data


image = data.astronaut()
rows, cols = image.shape[0], image.shape[1]

src_cols = np.linspace(0, cols, 20)
src_rows = np.linspace(0, rows, 10)
src_rows, src_cols = np.meshgrid(src_rows, src_cols)
src = np.dstack([src_cols.flat, src_rows.flat])[0]

# add sinusoidal oscillation to row coordinates
dst_rows = src[:, 1] - np.sin(np.linspace(0, 3 * np.pi, src.shape[0])) * 50
dst_cols = src[:, 0]
dst_rows *= 1.5
dst_rows -= 1.5 * 50
dst = np.vstack([dst_cols, dst_rows]).T


tform = PiecewiseAffineTransform()
tform.estimate(src, dst)

out_rows = image.shape[0] - 1.5 * 50
out_cols = cols
out = warp(image, tform, output_shape=(out_rows, out_cols))

fig, ax = plt.subplots()
ax.imshow(out)
ax.plot(tform.inverse(src)[:, 0], tform.inverse(src)[:, 1], '.b')
ax.axis((0, out_cols, out_rows, 0))
plt.show()
Total running time of the script: (0 minutes 0.870 seconds)