Note
Go to the end to download the full example code or to run this example in your browser via Binder
Separate colors in immunohistochemical staining#
Color deconvolution consists in the separation of features by their colors.
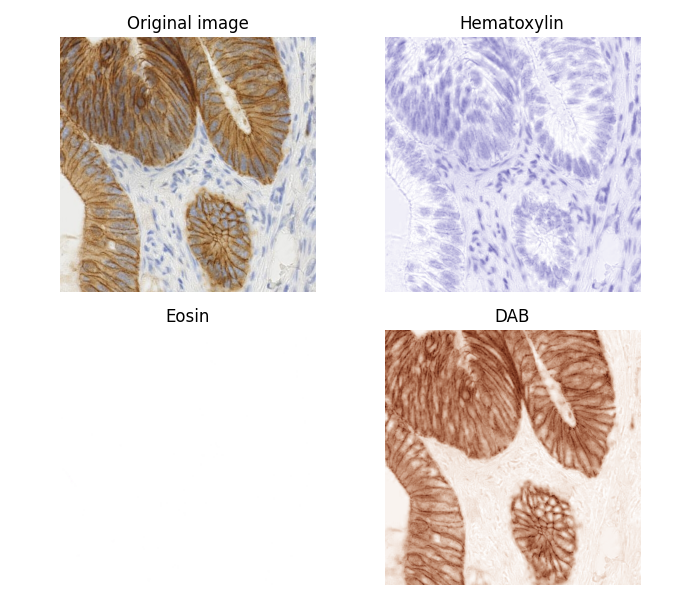
In this example we separate the immunohistochemical (IHC) staining from the hematoxylin counterstaining. The separation is achieved with the method described in [1] and known as “color deconvolution”.
The IHC staining expression of the FHL2 protein is here revealed with diaminobenzidine (DAB) which gives a brown color.
import numpy as np
import matplotlib.pyplot as plt

from skimage import data
from skimage.color import rgb2hed, hed2rgb

# Example IHC image
ihc_rgb = data.immunohistochemistry()

# Separate the stains from the IHC image
ihc_hed = rgb2hed(ihc_rgb)

# Create an RGB image for each of the stains
null = np.zeros_like(ihc_hed[:, :, 0])
ihc_h = hed2rgb(np.stack((ihc_hed[:, :, 0], null, null), axis=-1))
ihc_e = hed2rgb(np.stack((null, ihc_hed[:, :, 1], null), axis=-1))
ihc_d = hed2rgb(np.stack((null, null, ihc_hed[:, :, 2]), axis=-1))

# Display
fig, axes = plt.subplots(2, 2, figsize=(7, 6), sharex=True, sharey=True)
ax = axes.ravel()

ax[0].imshow(ihc_rgb)
ax[0].set_title("Original image")

ax[1].imshow(ihc_h)
ax[1].set_title("Hematoxylin")

ax[2].imshow(ihc_e)
ax[2].set_title("Eosin")  # Note that there is no Eosin stain in this image

ax[3].imshow(ihc_d)
ax[3].set_title("DAB")

for a in ax.ravel():
    a.axis('off')

fig.tight_layout()
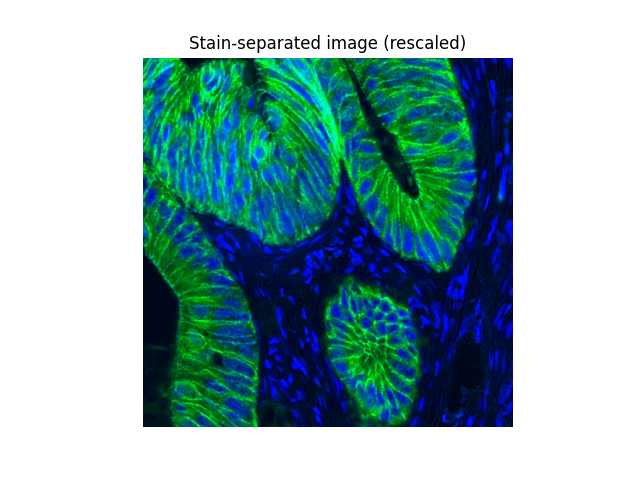
Now we can easily manipulate the hematoxylin and DAB channels:
from skimage.exposure import rescale_intensity

# Rescale hematoxylin and DAB channels and give them a fluorescence look
h = rescale_intensity(
    ihc_hed[:, :, 0],
    out_range=(0, 1),
    in_range=(0, np.percentile(ihc_hed[:, :, 0], 99)),
)
d = rescale_intensity(
    ihc_hed[:, :, 2],
    out_range=(0, 1),
    in_range=(0, np.percentile(ihc_hed[:, :, 2], 99)),
)

# Cast the two channels into an RGB image, as the blue and green channels
# respectively
zdh = np.dstack((null, d, h))

fig = plt.figure()
axis = plt.subplot(1, 1, 1, sharex=ax[0], sharey=ax[0])
axis.imshow(zdh)
axis.set_title('Stain-separated image (rescaled)')
axis.axis('off')
plt.show()
Total running time of the script: (0 minutes 1.495 seconds)