Note
Go to the end to download the full example code or to run this example in your browser via Binder
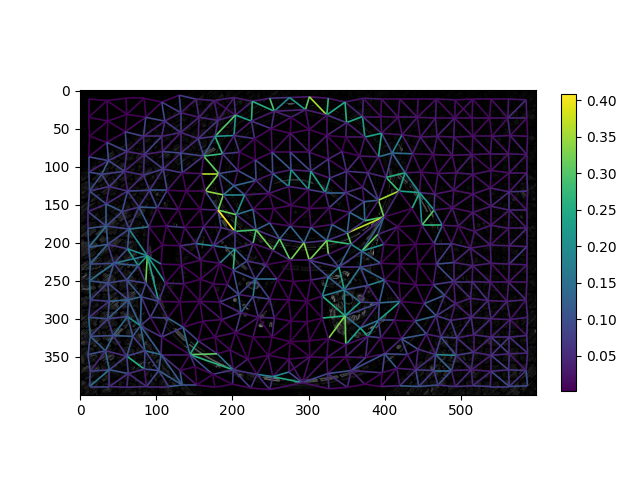
Region Boundary based Region adjacency graphs (RAGs)#
Construct a region boundary RAG with the rag_boundary function. The
function skimage.graph.rag_boundary() takes an
edge_map argument, which gives the significance of a feature (such as
edges) being present at each pixel. In a region boundary RAG, the edge weight
between two regions is the average value of the corresponding pixels in
edge_map along their shared boundary.
from skimage import graph
from skimage import data, segmentation, color, filters, io
from matplotlib import pyplot as plt


img = data.coffee()
gimg = color.rgb2gray(img)

labels = segmentation.slic(img, compactness=30, n_segments=400, start_label=1)
edges = filters.sobel(gimg)
edges_rgb = color.gray2rgb(edges)

g = graph.rag_boundary(labels, edges)
lc = graph.show_rag(
    labels, g, edges_rgb, img_cmap=None, edge_cmap='viridis', edge_width=1.2
)

plt.colorbar(lc, fraction=0.03)
io.show()
Total running time of the script: (0 minutes 0.817 seconds)