Note
Go to the end to download the full example code or to run this example in your browser via Binder
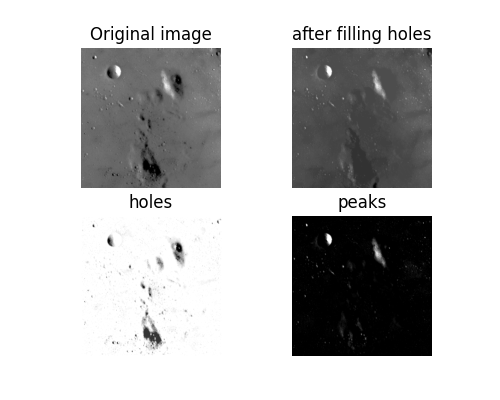
Filling holes and finding peaks#
We fill holes (i.e. isolated, dark spots) in an image using morphological reconstruction by erosion. Erosion expands the minimal values of the seed image until it encounters a mask image. Thus, the seed image and mask image represent the maximum and minimum possible values of the reconstructed image.
We start with an image containing both peaks and holes:
import matplotlib.pyplot as plt

from skimage import data
from skimage.exposure import rescale_intensity

image = data.moon()
# Rescale image intensity so that we can see dim features.
image = rescale_intensity(image, in_range=(50, 200))
Now we need to create the seed image, where the minima represent the starting points for erosion. To fill holes, we initialize the seed image to the maximum value of the original image. Along the borders, however, we use the original values of the image. These border pixels will be the starting points for the erosion process. We then limit the erosion by setting the mask to the values of the original image.
As shown above, eroding inward from the edges removes holes, since (by definition) holes are surrounded by pixels of brighter value. Finally, we can isolate the dark regions by subtracting the reconstructed image from the original image.
Alternatively, we can find bright spots in an image using morphological reconstruction by dilation. Dilation is the inverse of erosion and expands the maximal values of the seed image until it encounters a mask image. Since this is an inverse operation, we initialize the seed image to the minimum image intensity instead of the maximum. The remainder of the process is the same.
seed = np.copy(image)
seed[1:-1, 1:-1] = image.min()
rec = reconstruction(seed, mask, method='dilation')

fig, ax = plt.subplots(2, 2, figsize=(5, 4), sharex=True, sharey=True)
ax = ax.ravel()

ax[0].imshow(image, cmap='gray')
ax[0].set_title('Original image')
ax[0].axis('off')

ax[1].imshow(filled, cmap='gray')
ax[1].set_title('after filling holes')
ax[1].axis('off')

ax[2].imshow(image - filled, cmap='gray')
ax[2].set_title('holes')
ax[2].axis('off')

ax[3].imshow(image - rec, cmap='gray')
ax[3].set_title('peaks')
ax[3].axis('off')
plt.show()
Total running time of the script: (0 minutes 0.334 seconds)