Note
Go to the end to download the full example code or to run this example in your browser via Binder
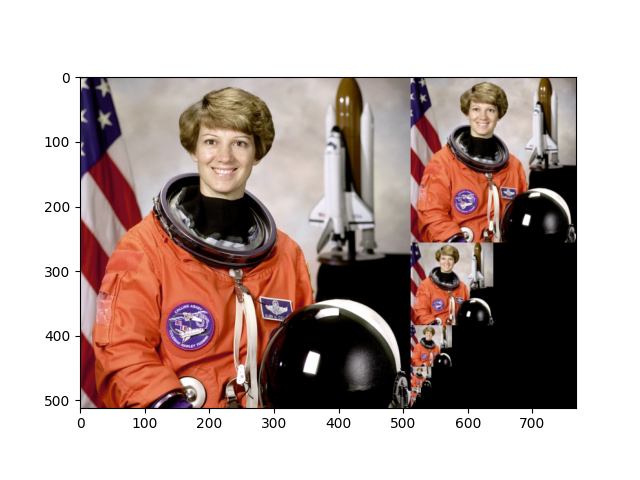
Build image pyramids#
The pyramid_gaussian function takes an image and yields successive images
shrunk by a constant scale factor. Image pyramids are often used, e.g., to
implement algorithms for denoising, texture discrimination, and scale-invariant
detection.
import numpy as np
import matplotlib.pyplot as plt

from skimage import data
from skimage.transform import pyramid_gaussian


image = data.astronaut()
rows, cols, dim = image.shape
pyramid = tuple(pyramid_gaussian(image, downscale=2, channel_axis=-1))
Generate a composite image for visualization#
For visualization, we generate a composite image with the same number of rows
as the source image but with cols + pyramid[1].shape[1] columns. We then
have space to stack all of the dowsampled images to the right of the
original.
Note: The sum of the number of rows in all dowsampled images in the pyramid may sometimes exceed the original image size in cases when image.shape[0] is not a power of two. We expand the number of rows in the composite slightly as necessary to account for this. Expansion beyond the number of rows in the original will also be necessary to cover cases where downscale < 2.
# determine the total number of rows and columns for the composite
composite_rows = max(rows, sum(p.shape[0] for p in pyramid[1:]))
composite_cols = cols + pyramid[1].shape[1]
composite_image = np.zeros((composite_rows, composite_cols, 3), dtype=np.double)

# store the original to the left
composite_image[:rows, :cols, :] = pyramid[0]

# stack all downsampled images in a column to the right of the original
i_row = 0
for p in pyramid[1:]:
    n_rows, n_cols = p.shape[:2]
    composite_image[i_row : i_row + n_rows, cols : cols + n_cols] = p
    i_row += n_rows

fig, ax = plt.subplots()
ax.imshow(composite_image)
plt.show()
Total running time of the script: (0 minutes 0.375 seconds)