Note
Click here to download the full example code or to run this example in your browser via Binder
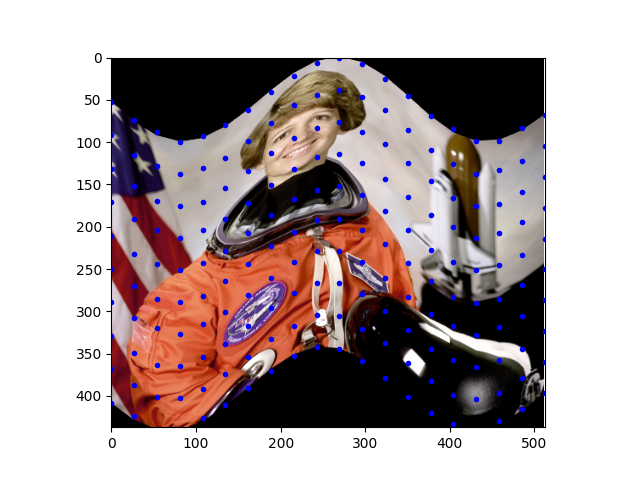
Piecewise Affine Transformation
This example shows how to use the Piecewise Affine Transformation.

import numpy as np
import matplotlib.pyplot as plt
from skimage.transform import PiecewiseAffineTransform, warp
from skimage import data


image = data.astronaut()
rows, cols = image.shape[0], image.shape[1]

src_cols = np.linspace(0, cols, 20)
src_rows = np.linspace(0, rows, 10)
src_rows, src_cols = np.meshgrid(src_rows, src_cols)
src = np.dstack([src_cols.flat, src_rows.flat])[0]

# add sinusoidal oscillation to row coordinates
dst_rows = src[:, 1] - np.sin(np.linspace(0, 3 * np.pi, src.shape[0])) * 50
dst_cols = src[:, 0]
dst_rows *= 1.5
dst_rows -= 1.5 * 50
dst = np.vstack([dst_cols, dst_rows]).T


tform = PiecewiseAffineTransform()
tform.estimate(src, dst)

out_rows = image.shape[0] - 1.5 * 50
out_cols = cols
out = warp(image, tform, output_shape=(out_rows, out_cols))

fig, ax = plt.subplots()
ax.imshow(out)
ax.plot(tform.inverse(src)[:, 0], tform.inverse(src)[:, 1], '.b')
ax.axis((0, out_cols, out_rows, 0))
plt.show()
Total running time of the script: ( 0 minutes 0.521 seconds)

 Source