Note
Click here to download the full example code or to run this example in your browser via Binder
Visual image comparison
Image comparison is particularly useful when performing image processing tasks such as exposure manipulations, filtering, and restoration.
This example shows how to easily compare two images with various approaches.
import matplotlib.pyplot as plt
from matplotlib.gridspec import GridSpec

from skimage import data, transform, exposure
from skimage.util import compare_images


img1 = data.coins()
img1_equalized = exposure.equalize_hist(img1)
img2 = transform.rotate(img1, 2)


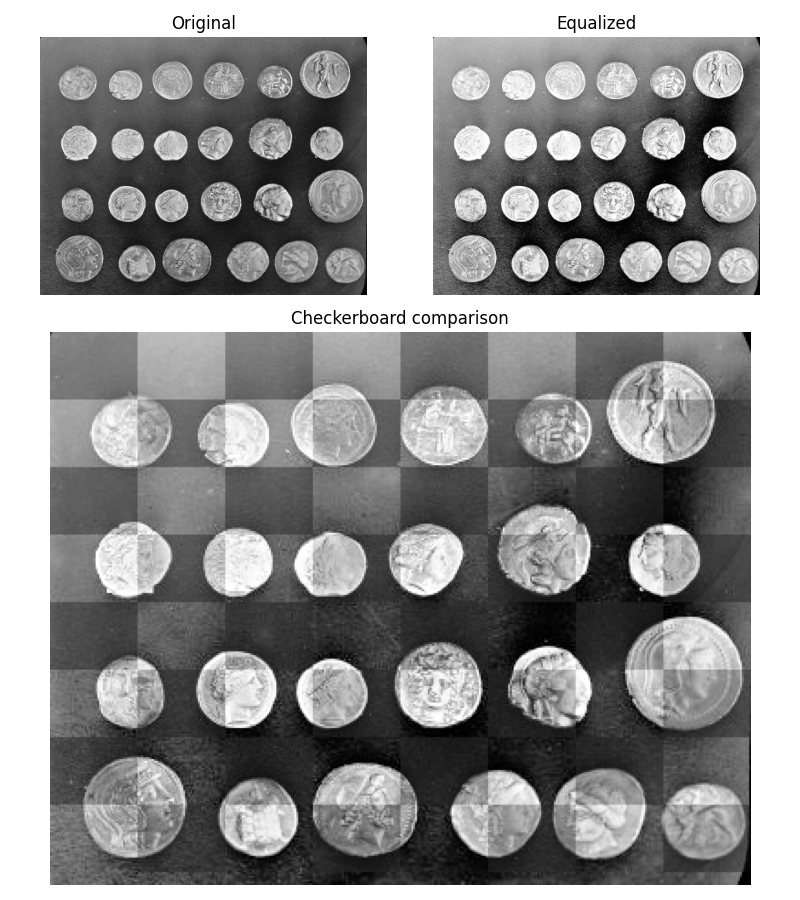
comp_equalized = compare_images(img1, img1_equalized, method='checkerboard')
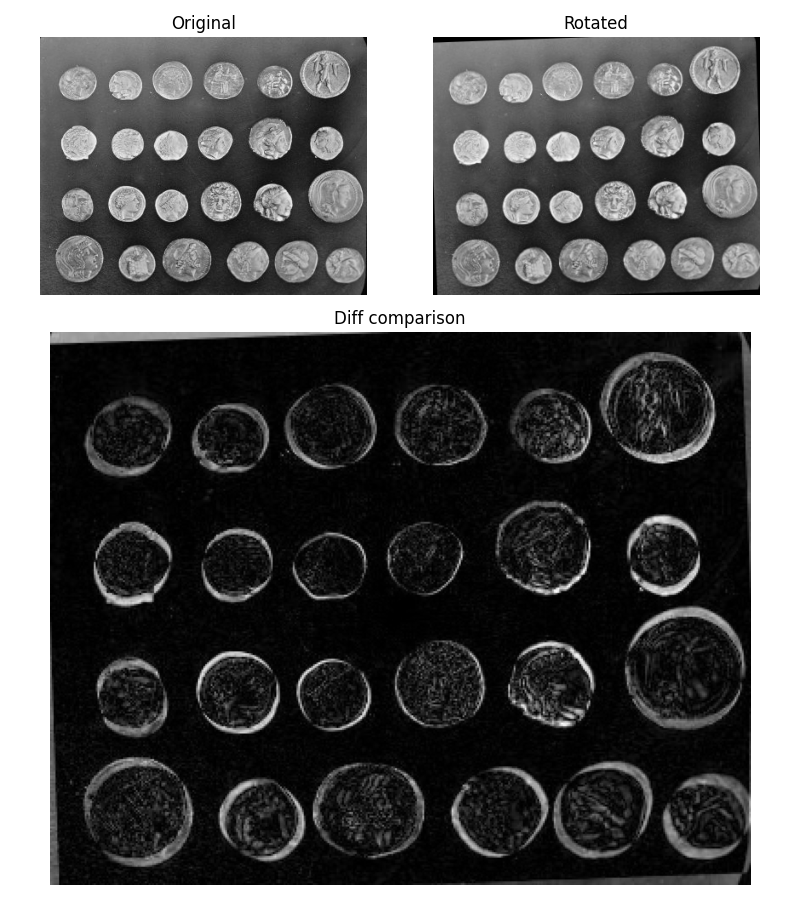
diff_rotated = compare_images(img1, img2, method='diff')
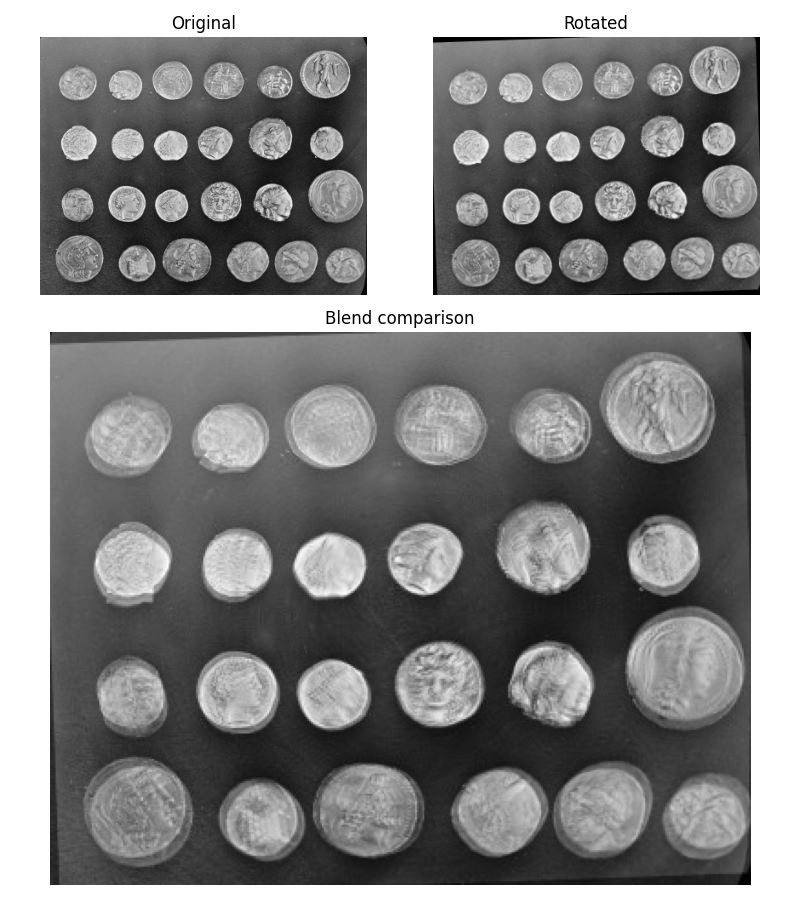
blend_rotated = compare_images(img1, img2, method='blend')
Checkerboard
The checkerboard method alternates tiles from the first and the second images.
fig = plt.figure(figsize=(8, 9))

gs = GridSpec(3, 2)
ax0 = fig.add_subplot(gs[0, 0])
ax1 = fig.add_subplot(gs[0, 1])
ax2 = fig.add_subplot(gs[1:, :])

ax0.imshow(img1, cmap='gray')
ax0.set_title('Original')
ax1.imshow(img1_equalized, cmap='gray')
ax1.set_title('Equalized')
ax2.imshow(comp_equalized, cmap='gray')
ax2.set_title('Checkerboard comparison')
for a in (ax0, ax1, ax2):
    a.axis('off')
plt.tight_layout()
plt.plot()

[]
Diff
The diff method computes the absolute difference between the two images.
fig = plt.figure(figsize=(8, 9))

gs = GridSpec(3, 2)
ax0 = fig.add_subplot(gs[0, 0])
ax1 = fig.add_subplot(gs[0, 1])
ax2 = fig.add_subplot(gs[1:, :])

ax0.imshow(img1, cmap='gray')
ax0.set_title('Original')
ax1.imshow(img2, cmap='gray')
ax1.set_title('Rotated')
ax2.imshow(diff_rotated, cmap='gray')
ax2.set_title('Diff comparison')
for a in (ax0, ax1, ax2):
    a.axis('off')
plt.tight_layout()
plt.plot()

[]
Blend
blend is the result of the average of the two images.
fig = plt.figure(figsize=(8, 9))

gs = GridSpec(3, 2)
ax0 = fig.add_subplot(gs[0, 0])
ax1 = fig.add_subplot(gs[0, 1])
ax2 = fig.add_subplot(gs[1:, :])

ax0.imshow(img1, cmap='gray')
ax0.set_title('Original')
ax1.imshow(img2, cmap='gray')
ax1.set_title('Rotated')
ax2.imshow(blend_rotated, cmap='gray')
ax2.set_title('Blend comparison')
for a in (ax0, ax1, ax2):
    a.axis('off')
plt.tight_layout()
plt.plot()

[]
Total running time of the script: ( 0 minutes 1.431 seconds)

 Source