Note
Click here to download the full example code or to run this example in your browser via Binder
Specific images
import matplotlib.pyplot as plt
import matplotlib

from skimage import data

matplotlib.rcParams["font.size"] = 18
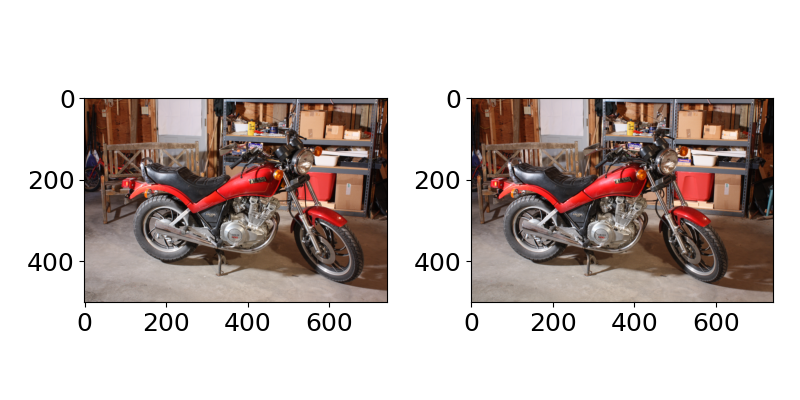
Stereo images
fig, axes = plt.subplots(1, 2, figsize=(8, 4))
ax = axes.ravel()

cycle_images = data.stereo_motorcycle()
ax[0].imshow(cycle_images[0])
ax[1].imshow(cycle_images[1])

fig.tight_layout()
plt.show()

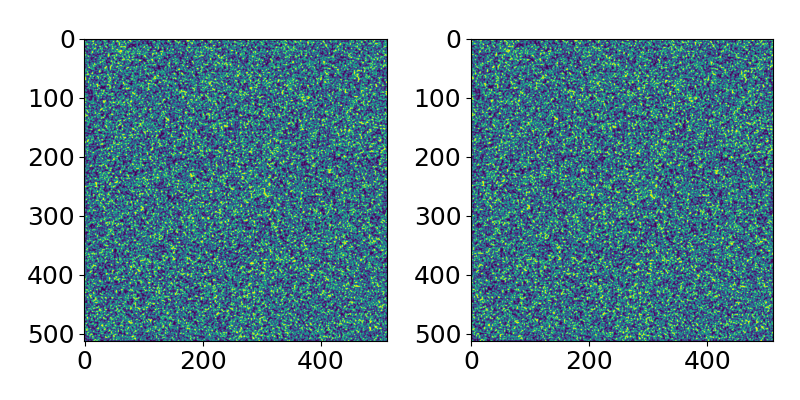
PIV images
fig, axes = plt.subplots(1, 2, figsize=(8, 4))
ax = axes.ravel()

vortex_images = data.vortex()
ax[0].imshow(vortex_images[0])
ax[1].imshow(vortex_images[1])

fig.tight_layout()
plt.show()

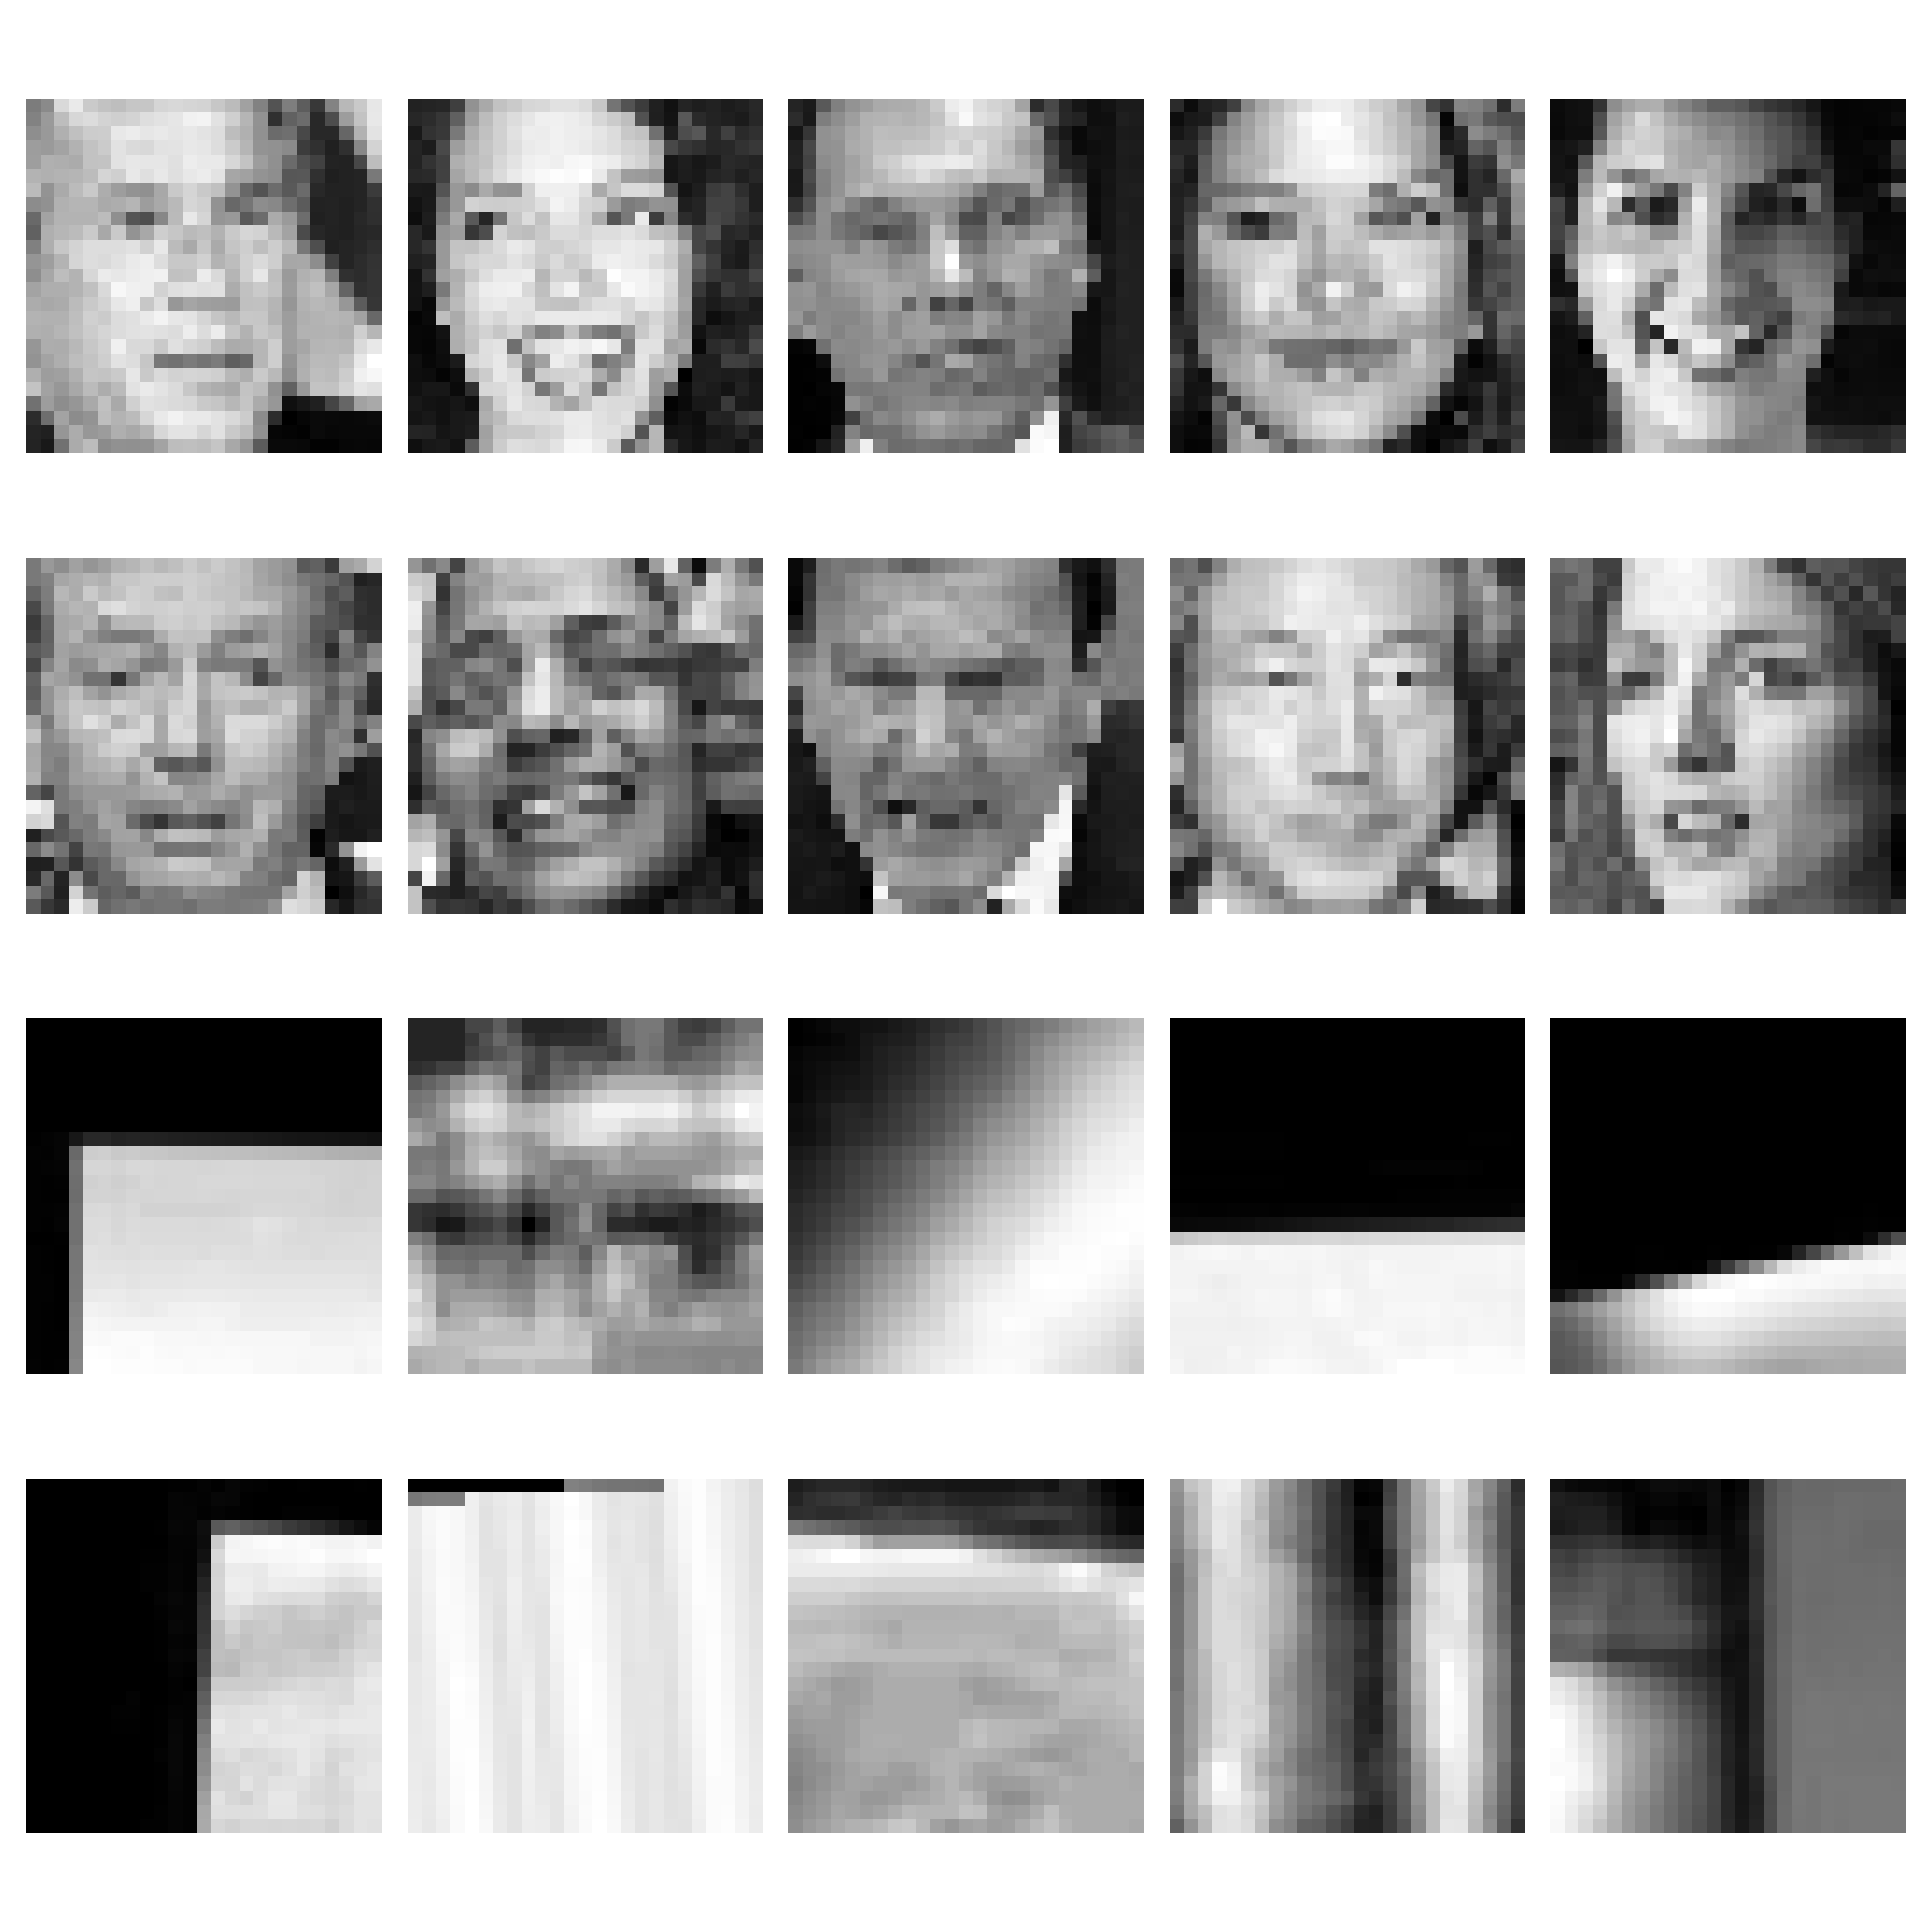
Faces and non-faces dataset
A sample of 20 over 200 images is displayed.
fig, axes = plt.subplots(4, 5, figsize=(20, 20))
ax = axes.ravel()
lfw_images = data.lfw_subset()
for i in range(20):
    ax[i].imshow(lfw_images[90 + i], cmap=plt.cm.gray)
    ax[i].axis("off")
fig.tight_layout()
plt.show()

Thumbnail image for the gallery
from matplotlib.offsetbox import AnchoredText

# Create a gridspec with two images in the first and 4 in the second row
fig, axd = plt.subplot_mosaic(
    [["stereo", "stereo", "piv", "piv"], ["lfw0", "lfw1", "lfw2", "lfw3"]],
)
axd["stereo"].imshow(cycle_images[0])
axd["stereo"].add_artist(
    AnchoredText(
        "Stereo",
        prop=dict(size=20),
        frameon=True,
        borderpad=0,
        loc="upper left",
    )
)
axd["piv"].imshow(vortex_images[0])
axd["piv"].add_artist(
    AnchoredText(
        "PIV",
        prop=dict(size=20),
        frameon=True,
        borderpad=0,
        loc="upper left",
    )
)
axd["lfw0"].imshow(lfw_images[91], cmap="gray")
axd["lfw1"].imshow(lfw_images[92], cmap="gray")
axd["lfw2"].imshow(lfw_images[93], cmap="gray")
axd["lfw3"].imshow(lfw_images[94], cmap="gray")

for ax in axd.values():
    ax.axis("off")
fig.tight_layout()
plt.show()

Total running time of the script: ( 0 minutes 1.427 seconds)

 Source